


Stocks S&P 500, Gold, Crude Oil and the Banks Trend Trading Forecasts
Stock-Markets / Financial Markets 2010 Dec 01, 2010 - 02:28 PM GMTBy: J_W_Jones

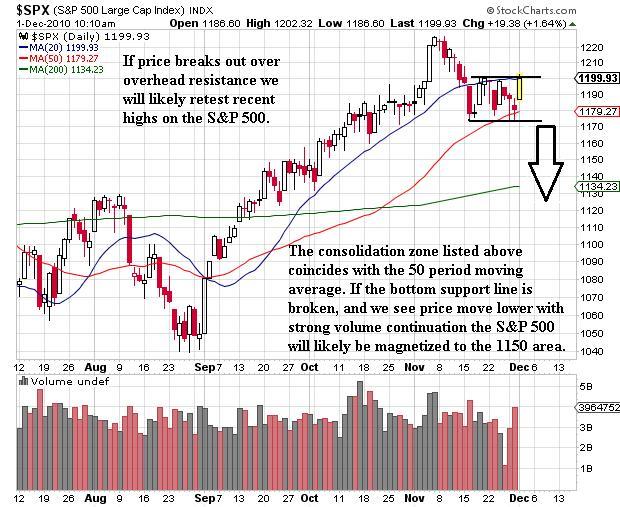
 Sellers were in control most of the trading session on Tuesday, however an overnight buying surge pushed the S&P 500 back up to overhead resistance as the directional battle raged on between the bulls and the bears. For over a week we have had relatively choppy trading as the S&P 500 has remained in a tight range between the 20 and 50 period moving averages. By the open Wednesday, the U.S. financial markets demonstrated their resiliency yet again. It is critical to note that we received our first and second official tests of the 50 period moving average on the S&P 500 daily chart.
While recent analysis has offered that prices are consolidating and that a significant move is likely to play out, it is too early to be making market prognostications about what is to come. However, the S&P 500 is leaving us with a few clues about potential direction which is apparent through the lens of technical analysis. While the 50 period moving average was tested both Monday and Tuesday, price action early Wednesday morning was extremely bullish on the heals of a solid ADP employment report and a slight pullback in the U.S. Dollar. As stated in my previous analysis, we will remain in a technical uptrend until we get sustained prices below the 50 period moving average on the daily chart of the S&P 500.
As most veteran traders realize, key price levels weaken each time they are tested until eventually they break. Time and price will line up and we will either have a strong sell-off, or the equities market will bounce and test the recent highs. Now that we have had a second test of the 50 period moving average, the 3rd test may see the support level give way to lower prices. If prices break below recent support and we lose the 50 period moving average, it is likely price will correct to the S&P 1150 level with the possibility of testing the 200 period moving average. In contrast, should the S&P 500 price breakout over recent resistance we could challenge new highs. At this point in time, price action should be monitored closely to see how the S&P 500 handles these key levels.
S&P 500
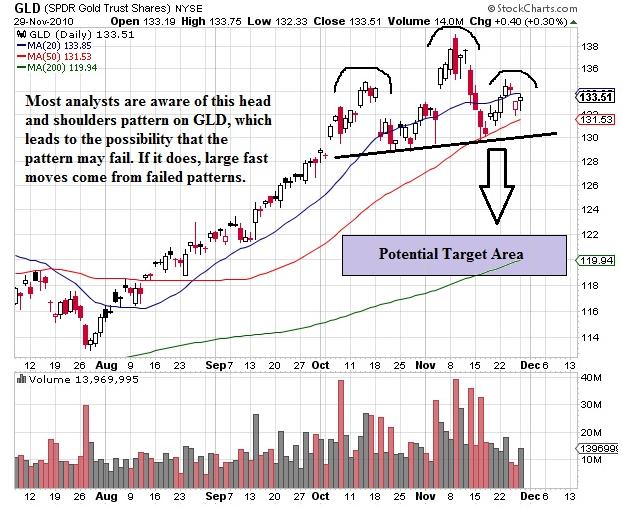
Gold
Gold and silver had strong advances higher on Monday and Tuesday with the U.S. Dollar continuing its rally. While not a frequent occurrence, a simultaneous rally in the U.S. Dollar and precious metals is typically the result of abnormal market conditions. The crisis unfolding in Europe was likely the force behind the mutual rally in precious metals and the U.S. Dollar as central bankers and asset managers fled the Euro seeking safe havens. The dollar continues to sustain bullish price action and has the potential to go much higher than many traders and money managers may expect.
Gold and silver have had monster sized runs and appear to be consolidating before making their next move. While the ominous head-and-shoulders pattern is apparent on GLD's daily chart, the potentially more negative aspect regarding the metals is their widespread acceptance as a safe investment by the retail crowd. While gold and silver could continue higher, at some point it would be healthy to see a pullback and with so many retail investors long gold and silver, a strong correction would wash out emotional bullish traders before ultimately heading higher.
At this point, I am sitting back and watching the price action unfold, but should the neckline of the head and shoulders pattern break to the downside, I will likely get involved with some downside exposure.
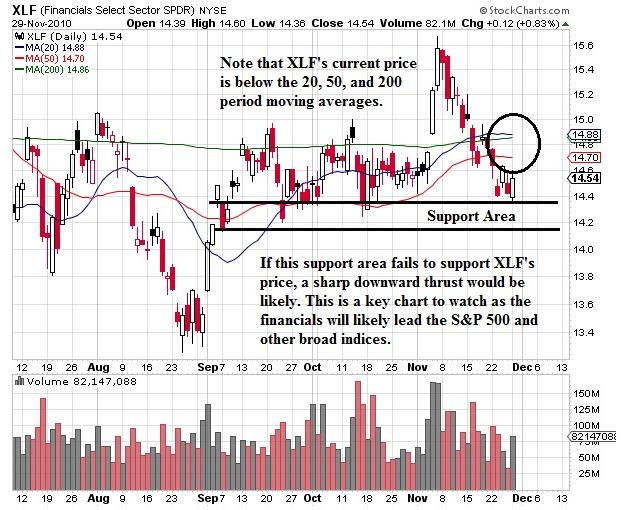
XLF (Financials)
U.S. banks have been under pressure as a variety of headwinds faces the sector. Most of the banking concerns of which traders are aware are increased regulation, foreclosure nightmares, capital formation issues, and commercial real estate and development problems. Has anyone given any thought to whether U.S. Banks have any exposure to the European banking/sovereign fallout? It is without question there is exposure, the more appropriate question should be who is exposed, and how much risk did they take on? Since we will likely not prospectively know who is exposed until price action confirms their identity, the safest way to play that potential risk is through the financial ETF XLF.
Through the use of this ETF, traders can broaden their horizon and focus more on the price action without worrying about which specific banks are exposed to heightened risk. XLF has already broken down below its 50 period moving average on the daily chart. While a bounce is likely, if the 50 or 20 period moving average hold XLF down, it is likely we will see prices roll over and XLF could potentially challenge new lows. Should this take place, the S&P 500 will likely follow in the XLF's footsteps.
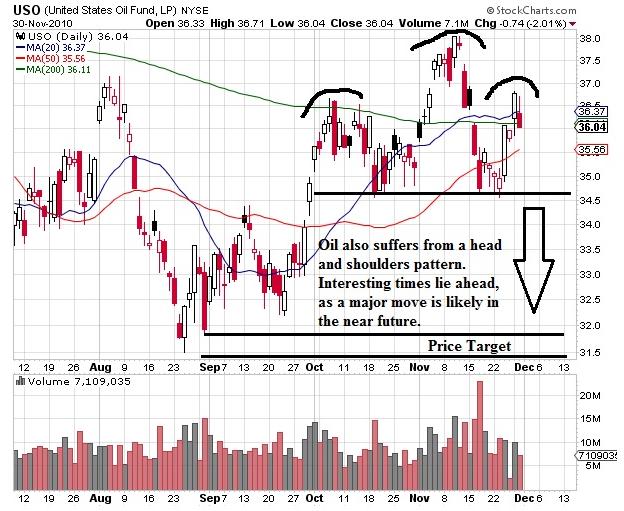
USO (Oil)
Traders moved oil prices higher on Monday, but Tuesday saw market participants take profits and push USO lower by the closing bell. USO, much like gold and silver is a mixed bag when looking at the daily chart. On one hand, we can see that Monday’s action pushed prices above the 20 period moving average. During intra-day trading on Tuesday, price tested the 20 period moving average and support held firm. Wednesday morning energy traders pushed oil higher, but as of the writing of this article oil was trading at resistance. While there are clearly bullish signals on the USO daily chart, USO appears to be forming a head and shoulders pattern similar to gold. With conflicting technical information, sitting on the sidelines and waiting for price and direction to be confirmed is likely a sound decision, at least that is the way I am playing it.
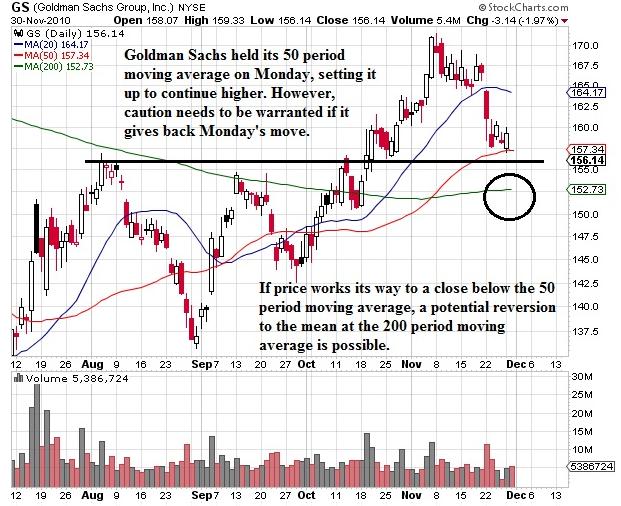
Goldman Sachs
Goldman Sachs (GS) is offering two interesting trading setups that option traders could use which have a different directional bias. The daily chart places Goldman in a descending channel and provides traders who want to get short with defined risk. Those who remain bullish could get long and use the 50 period moving average as a stop. At this stage in the December option expiration cycle, utilizing time decay (Theta) as either a profit engine or a way to reduce the cost of a spread is a sound trading strategy.
With less than 3 weeks until expiration, time decay (Theta) accelerates rapidly on its inevitable path to 0 at expiration. This process increases dramatically the final two weeks leading up to expiration. Option traders that utilize time decay (Theta) to reduce the cost of a spread or as the primary profit engine of a trade construction (credit trades) are capitalizing on an inevitability.
Clearly there are inherent risks such as an increase in implied volatility, but without question at option expiration the time value of options will be reduced to 0. Time decay (Theta) and implied volatility are the two most likely culprits as to why novice option traders consistently lose money trading options. Understanding a few basic principles regarding option Greeks is critical in order to produce profits. The daily chart of Goldman Sachs is shown below.
Those who are bullish with regard to Goldman Sachs could use a call vertical (bull call spread) with the following strikes:
Long 1 December 160 Call Contract
Short 1 December 165 Call Contract
Through the use of a hard stop well below the 50 period moving average, an option trader could define his risk while having a quality risk / reward trade. The maximum loss on this trade would be less than $180 per leg while the maximum gain would be slightly over $320 not including commissions as of Wednesday morning. The use of a hard stop would reduce risk further and could potentially lead to a nice profit in days to come.
For traders who want to press the downside, a put vertical (bear put spread) could be used with a contingent stop around the $161/share price level. The trading setup is as follows:
Long 1 December 160 Put Contract
Short 1 December 155 Put Contract
The maximum loss per side for this trade would be around $230 while the maximum gain is $270 as of the Wednesday morning. Similarly to the call vertical spread listed above, the use of the contingent stop reduces the intra-day risk even further. While these setups are about as basic as it gets regarding option trading, they can really produce some nice profits. Again, these are not recommendations, but simply an example of the profitability that options can add to your trading if they are used appropriately.
In closing, we are seeing a lot of head and shoulders patterns developing in a variety of trading vehicles. While these patterns can mean substantial downside is ahead, there is always the potential that they could fail. Failed patterns result in fast, potentially devastating moves. If the head and shoulders patterns we are seeing in the S&P 500, gold, and oil fail a fast paced rally will likely unfold. In contrast, if the patterns play out a nasty sell-off could take place. At this point in time, a significant move is likely to unfold, but as usual which direction prices will eventually go remains unknown.
I am giving away my free analysis & book on how to find and trade the right options strategy This short and to the point guide is full of my trading techniques and tips which will help you not only protect your portfolio but grow it.
Download Book: http://www.optionstradingsignals.com/profitable-options-solutions.php
If you would like to continue learning about the hidden potential options trading can provide please join my FREE Newsletter: www.OptionsTradingSignals.com
J.W. Jones is an independent options trader using multiple forms of analysis to guide his option trading strategies. Jones has an extensive background in portfolio analysis and analytics as well as risk analysis. J.W. strives to reach traders that are missing opportunities trading options and commits to writing content which is not only educational, but entertaining as well. Regular readers will develop the knowledge and skills to trade options competently over time. Jones focuses on writing spreads in situations where risk is clearly defined and high potential returns can be realized.
This article is intended solely for information purposes. The opinions are those of the author only. Please conduct further research and consult your financial advisor before making any investment/trading decision. No responsibility can be accepted for losses that may result as a consequence of trading on the basis of this analysis.
© 2005-2022 http://www.MarketOracle.co.uk - The Market Oracle is a FREE Daily Financial Markets Analysis & Forecasting online publication.