


Market Concerns Over Euro-Zone Bailout, Smart Money Preparing to Sell Stocks Hard
Stock-Markets / Financial Markets 2010 Nov 29, 2010 - 03:38 AM GMT

 (ZeroHedge) Despite its illiquidity, The FX market has been the first and earliest indicator of how the market is taking the Irish bailout. So far it has been a complete abortion, and after opening in the mid 1.33 in the interbank market, the EURUSD has just touched on 1.3196, and is about to take out Friday support. The vigilantes refuse to go away. In addition to LCH margin hikes on Portugal and Spanish bonds tomorrow which now appears inevitable, we continue to expect that FX margin requirements will be hiked over the next few days across the board. Lastly, expect to hear rumors of secret service chasing any and all bond shorts/CDS longs. The war for the Eurozone's survival is now on in earnest.
Smart Money Preparing For Sell Off Like Never Before
Zero Hedge readers already know that in the latest week the insider selling to buying ratio hit unprecedented levels. Obviously, corporate officers and insiders have decided to take advantage of the artificial wealth effect and bail, especially since it is still unclear whether capital gains taxes will be the same in the following year. However, it is not only insiders who see between the lines. As the following charts demonstrate, the smart money is now either bailing from the stock market in droves or hedging for a market crash like never before...
VIX broke out a second time.
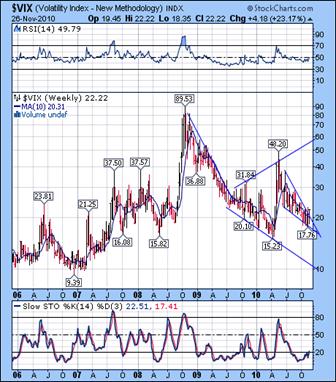 --The VIX emerged above the upper trendline of its wedge as well as the 10-week moving average at 20.31. By Friday the VIX also made a short-term/intermediate-term Support/Resistance bullish crossover. These two items make a very strong case for a continuation of the move this coming week and a buy signal for the VIX.
This week was a stealth week, since the entirety of the breakout happened on Friday while most traders were enjoying the holiday. The VIX also threw a curveball at most traders by executing a 5-point reversal (Broadening Formation) not visible in the weekly chart which calls for a “melt-up” in the VIX.
SPX is sitting on its 10-week moving average.
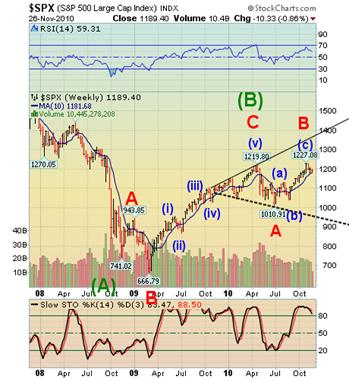 The SPX tested its 10-week moving average at 1181.68, but could not break through. However, a valid reversal formation has been made and a drop through the10-week moving average will confirm the downtrend. It is now ready for a waterfall decline that Edwards & McGee made famous as the Orthodox Broadening Top.
The SPX stayed below the 50% retracement of its decline from the top on November 5th this week, but the low volume allowed a fair amount of volatility as the HFT computers attempted to move the SPX higher.
Volume was anemic, not only due to the shortened week, but also on a daily basis as well.
The NDX completed its reversal pattern.
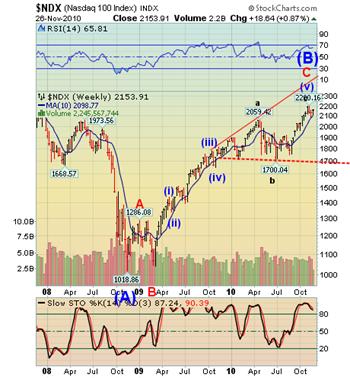 --The NDX closed at the 61.8% retracement level on Friday and a reversal pattern is also in place. My Model now suggests that a very sharp decline to Model Support and the Lower Broadening Top trend line may begin.
Thanksgiving was a week to stall the inevitable decline with a shortened trading week and low volume allowing the HFT computers to keep the market aloft. The NDX also stayed above an important daily support on Wednesday and Friday. A volume surge accompanying a panic dump into the close managed to pull the daily volume just barely higher than last Xmas eve (though still about 60% of last Black Friday). Just after the market closed, the NDX futures fell below its short-term Trend Support at 2142.00. The question is, will the market drop below all supports on Monday’s open?
Gold remains above supports.
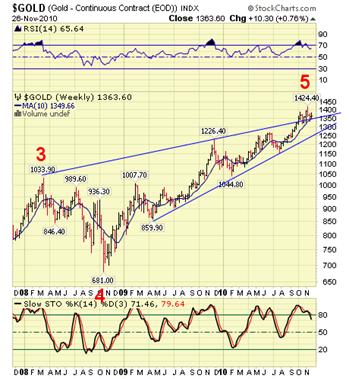 -- Gold tested its Wedge trendline and 10-week moving average for a second week,. It also has made a reversal pattern indicating a decline is forthcoming. The next target for gold is the lower trendline of the Wedge.
Monday will be a test whether the Fed and its double POMO can keep the markets elevated. The evidence is mounting that they cannot.
$WTIC completed a weekly reversal pattern.
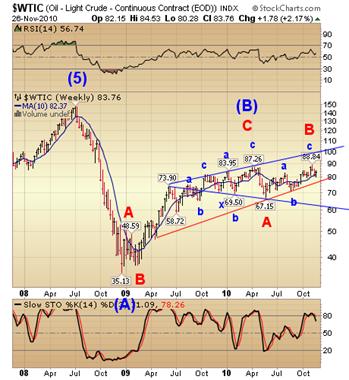 -- $WTIC challenged its 10-week moving average and completed a weekly reversal pattern, making it a candidate for a breakdown. The immediate Model target for $WTIC is 70.00, but it would be no surprise to see it decline to the lower Broadening Top trendline.
The point of recognition will be the crossing of the 10-week moving average. The weekend oil futures are higher (near 84.00) but not a threat to the reversal pattern. There may be a pump-and-dump scenario on Monday.
The Bank Index broke out of its Diamond formation.
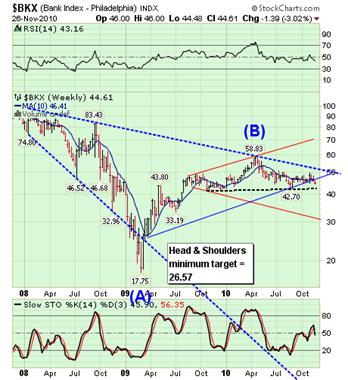 --The $BKX broke below the lower trendline of its Diamond formation and below the 10-week moving average at 46.41. The BKX has now activated a powerful sell signal whose target may be the lower trendline of the Orthodox Broadening Top.
The Diamond Formation should give us a swift and sharp decline averaging 20%. However there is a Head & Shoulders pattern in conjunction witht the Diamond, which gives us a deeper target. The BKX is our leading index, so the others should follow in like fashion.
The Shanghai Index is at a crossroads.
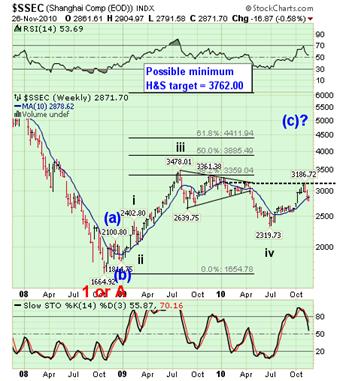 --The Shanghai Index has declined near the 50% retracement at 2753, but has started to bounce back towards its potential Head & Shoulders neckline. It can either rally from here or finish its retracement as low as 2705 and still be capable of another rally above its triangle. The H&S minimum target is very near the 50% retracement of the 2007-2008 decline.
China’s stock market is falling this morning.
$USB makes a reversal pattern.
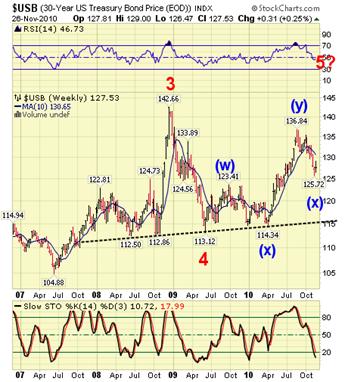 -- $USB appears to have completed a reversal pattern last week. It seems that the week’s positive performance in equities kept the long bond in neutral. The daily charts show that it has gained support at 126.84 and may challenge its 10-week moving average this week.
If it continues within its weekly trading channel since 1995 we may see a high over 150 in $USB. A potential target may be 155.00.
$USD surged above its 10-week moving average.
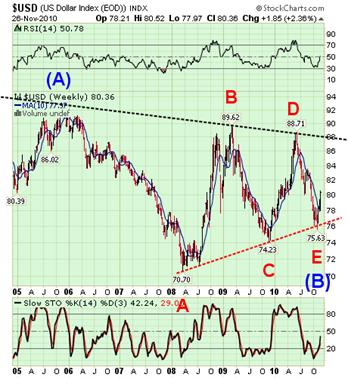 -- $USD surged above its 10-week moving average this week. It is approaching a Model Trend Resistance at 81, which will give us an indication of future strength. How well it does at that resistance will give us further indications of its rising potential. The chart pattern is unmistakably a triangle. That means wave (C) is just beginning. A sharp move out of the triangle should confirm the pattern.
The dollar rose to a two-month high against the euro after European Central Bank council member Christian Noyer said monetary easing creates the potential for global imbalances, boosting demand for safer assets.
Regards, Tony
Traders alert: The Practical Investor is currently offering the daily Inner Circle Newsletter to new subscribers. Contact us at tpi@thepracticalinvestor.com for a free sample newsletter and subscription information.
Our Investment Advisor Registration is on the Web
We are in the process of updating our website at www.thepracticalinvestor.com to have more information on our services. Log on and click on Advisor Registration to get more details.
If you are a client or wish to become one, please make an appointment to discuss our investment strategies by calling Connie or Tony at (517) 699-1554, ext 10 or 11. Or e-mail us at tpi@thepracticalinvestor.com .
Anthony M. Cherniawski, President and CIO http://www.thepracticalinvestor.com
As a State Registered Investment Advisor, The Practical Investor (TPI) manages private client investment portfolios using a proprietary investment strategy created by Chief Investment Officer Tony Cherniawski. Throughout 2000-01, when many investors felt the pain of double digit market losses, TPI successfully navigated the choppy investment waters, creating a profit for our private investment clients. With a focus on preserving assets and capitalizing on opportunities, TPI clients benefited greatly from the TPI strategies, allowing them to stay on track with their life goals
Disclaimer: The content in this article is written for educational and informational purposes only. There is no offer or recommendation to buy or sell any security and no information contained here should be interpreted or construed as investment advice. Do you own due diligence as the information in this article is the opinion of Anthony M. Cherniawski and subject to change without notice.
Anthony M. Cherniawski Archive |
© 2005-2022 http://www.MarketOracle.co.uk - The Market Oracle is a FREE Daily Financial Markets Analysis & Forecasting online publication.