Stock Market Short-term Consolidation, Finding Support at Bottom of Expanding Bullish Channel
Stock-Markets / Stock Markets 2010 Nov 23, 2010 - 04:46 AM GMTBy: Andre_Gratian
 Current Position of the Market
Very Long-term trend - The very-long-term cycles are down and if they make their lows when expected, the secular bear market which started in October 2007 should continue until about 2014-2015.
Long-term trend - In March 2009, equity markets began a corrective move in the form of a mini bull market. Cycles point to a continuation of this trend into 2011.
SPX: Intermediate trend.Technical observations point to a potential intermediate top in mid to late December
Analysis of the short-term trend is done on a daily basis with the help of hourly charts. It is an important adjunct to the analysis of daily and weekly charts which discusses the course of longer market trends.
Overview:
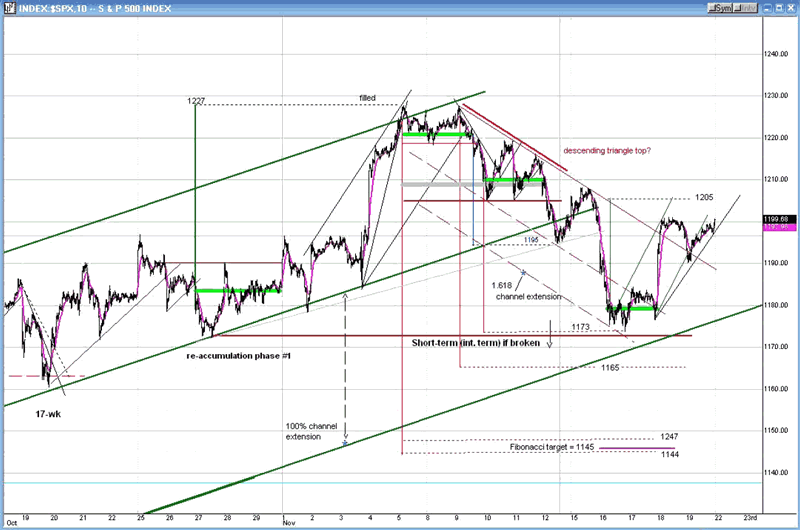
In the last newsletter, I gave some potential Point & Figure projections for the rally from 1172. While higher counts were possible, the SPX chose to reverse after meeting only the 1227 target. Here is an update of my projection chart to last Friday. It is provided as a substitute for an actual Point & Figure chart -- which I do not have the capability of reproducing -- in order to point out accumulation and distribution phases from which price objectives for the next move can be derived.
There are two potential distribution tops on this chart. The first one, at the very top, is marked in green and had given us a target of 1195 for the decline. That projection is marked in blue on the chart and, as you can see, it was met right on the nose and produced a rally.
Because that rally turned out to be an interim move in a larger decline, and since we had moved beyond the top projection, it became necessary to look for a larger distribution pattern which, I assumed, was in the form of a descending triangle (marked in red), and which had a phase distribution outlined in gray. That gave us the targets that are marked on the chart: 1165 and about 1145. Out of that pattern, I have isolated the first phase, which I marked in green. That phase counted down to 1173, and this is where the decline ended on 11/16.
We must now decide whether the correction will stop here, or if it will continue down to the lower potential projections. This is something that we will ponder as we continue our analysis by looking at other charts and indicators.
Analysis
We'll start with the SPX Daily Chart. Let's concentrate on the move which started at 1041 and which topped at 1227. After a sharp three-day thrust from the low, prices started to move in a narrow channel, and this continued until they reached 1227 ten weeks later. By increasing the width of the original channel by 100%, one could connect the bottom channel line with the low of the move at 1241, thereby creating a channel twice as wide as the original one. The bottom of the new channel is where the decline from 1227 found support and rallied. When this condition occurs, it's usually the case that prices will continue moving up in the lower part of the larger channel.
We had essentially the same type of pattern in the move that went from the March 2009 low of 667 to 1050. This was followed by a small decline to the wider channel, and then prices moved up for another ten weeks, remaining confined to the lower half of the wider channel until they finally topped at 1219.80 in late April. If the coming retracement of the current rally does not make a new low, a similar situation will probably take place in the next few weeks.
If the SPX does not make a new low! There are a couple of good reasons for a retracement to take place. The projection for the current rally is 1205. If we do move up to that level on Monday, it will most likely mark a temporary high. If you look at the chart below, you will notice that some black asterisks marked two of the last three tops. They measure the span of a 73-75 day cycle which has been identifying tops for quite some time. Since Monday is the 73rd day from the last date of August 9, and since the target for the rally from 1173 is ideally 1205, there is a good chance that the SPX will make a top on Monday at about 1205!
There is another factor which will come into play to bring prices down over the next week or so. November 29th is slated to be the low of the 90-day cycle. Putting these conditions together, we can say with fairly good assurance that, after potentially completing its move on Monday, the rally from 1173 will then retrace one more time to the low of the wider channel by next Monday, and this will be followed by a resumption of the move from 1040. How much farther will it go? We should be able to estimate this after the correction is completed.
Caveat: Although holding the bottom of the channel is the scenario that I favor, I also keep in mind that, if the SPX decides to move lower, it could reach the lower targets established by the full distribution pattern shown on the projection chart (gray area).
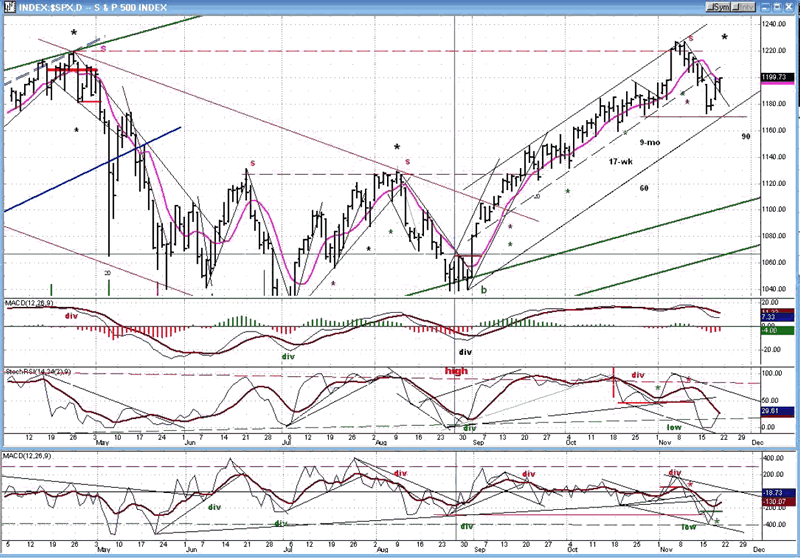
Let's now take a look at the indicators at the bottom of the chart. The top indicator (MACD) did not show any negative divergence at the 1227 top. This is normally a sign that the move is not finished. Nor was there any deceleration in the price trend, which is demonstrated by the fact that prices went all the way to the top of their channel before correcting. Had we witnessed deceleration, we could have presumed that the decline would probably be of a significant magnitude. Under the present circumstances, I suspect that there will be one more leg up (to the unfilled projection of 1039-1040?) before we make a top of intermediate proportions.
The lower two indicators are not yet in a position to signal the resumption of the uptrend, but a correction of another week or so would probably bring them to such a state of readiness.
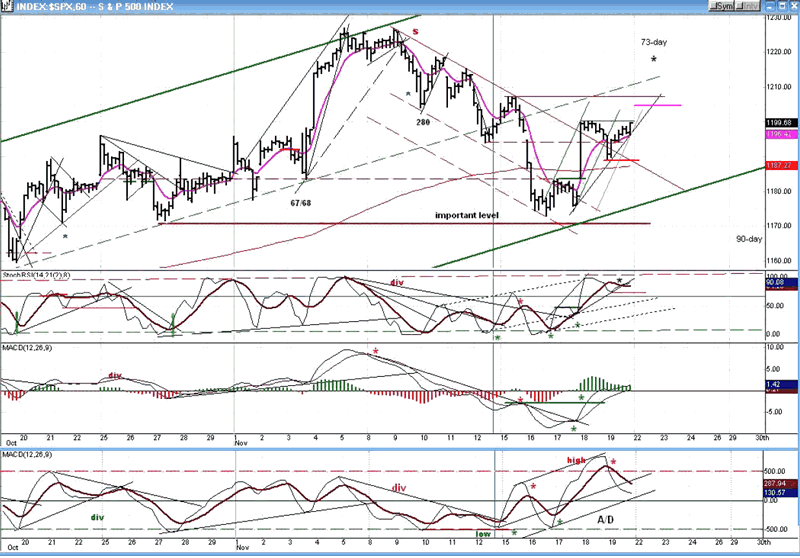
We can now turn to Hourly Chart refinements for our near-term analysis. After slightly surpassing the April high of 1220, The SPX started to decline in a narrow channel until it met its 1195 projection, and then rallied.
The realization that the index was not going to break through its downtrend line brought some severe selling which broke through the bottom of the channel and extended it by 1.618 of its original width (Fibonacci relationships are often useful in channel analysis). The decline stopped at the phase projection of 1173, formed a small base, and shot out of it on the upside, breaking and closing above the top channel line. That is a sign of strength which was further substantiated by its making only a .382 correction before resuming the uptrend in what is probably an incomplete fifth wave of the move from 1173 which, according to the base established at 1173, should end at 1205.
The top momentum indicator turned up again after coming down from an overbought position, and is now beginning to show some negative divergence and hugging its trend line, which are signs that the rally is nearly over. Negative divergence is the most severe in the A/D indicator. Even with the resumption of the uptrend, it has not been able to turn back up after correcting from an extremely overbought state.
If my assumption that the index will retrace one more time to the bottom of the channel by the cycle's low before the rally from 1041 resumes, the pull-back should begin when the uptrend line is broken, followed by a penetration below the 1190 level. However, If the index breaks below the red horizontal line, we are probably headed toward the lower targets noted on the projection chart above.
Cycles
I have already mentioned the two cycles which can influence the market over the near-term. The 73-td topto- top cycle, and the 90 calendar day cycle. I am not aware of any other short-term cycles on the horizon, and the market should continue to be under the influence of the longer term cycles which are driving the bull market from the March 2009 low.
Projections
I have already discussed the potential lower projections to 1165 and to about 1145, and the 1205 target for the current rebound from 1173. I cannot give any near-term target for the pull-back after reaching 1205 until a near-term top has been established. Also, we will have to see what kind of pattern has been made after the rally resumes.
Breadth
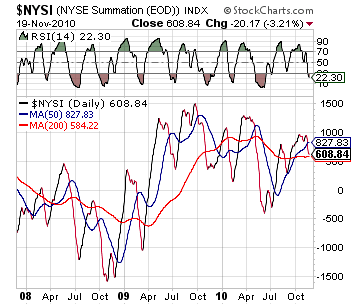
The last letter stated: The NYSE Summation index (courtesy of StockCharts.com) is struggling to stay in an uptrend, and the RSI is still overbought and showing increasing negative divergence. These are signs that a short-term top is not too far away .
True to form, the correction started shortly after this was written. Now, just as the daily indicators point to more consolidation, the RSI is telling us that we are not quite ready to resume the uptrend. Also, like the lack of negative divergence in daily indicators, the lack of relative weakness in the NYSI vs. the SPX is saying that we have probably not yet reached a high of intermediate consequence.
Market Leaders and Sentiment
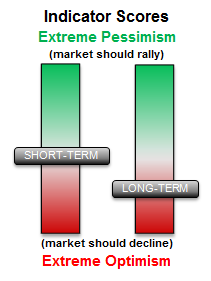
I am happy to say that, after a brief interlude of being unavailable, the SentimenTrader (courtesy of same) is once again accessible. As you can see, the long-term tells us that we are approaching an intermediate top, but my experience with this indicator is that it will have to get more negative before this comes to fruition. The short-term is currently neutral.
Gold
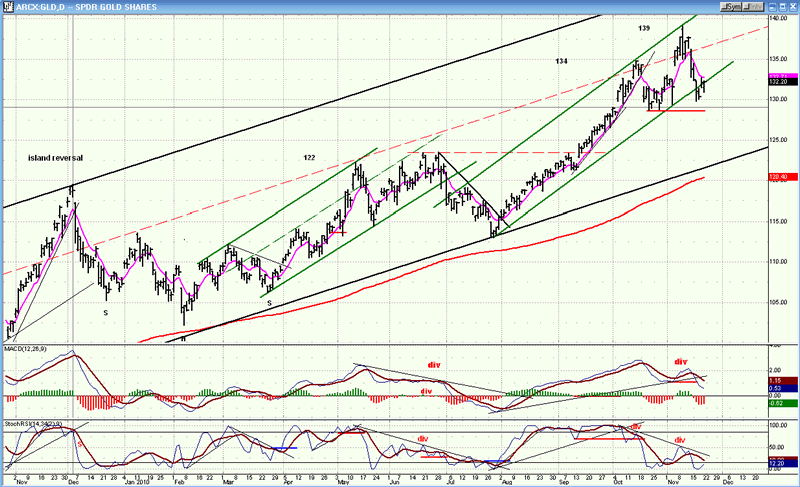
GLD met its 139 objective and promptly backed off. Its chart is somewhat similar to that of the equity indices which backed off on the same date when the SPX met its 1227 target.
I am assuming that the pattern will continue to be essentially similar over the next few weeks, as both indices are in the process of making what could turn into an intermediate top.
Just like the SPX, GLD will have to complete its topping pattern before we can assign a downward target to the coming correction.
Summary
After reaching its 1227 projection, the SPX has entered a short-term consolidation with prices finding support at the bottom of an expanded bullish intermediate channel. The current bounce is likely to be part of a slightly larger base which is in the process of being formed near the 1173 level. Another test of the channel line is likely as the 90-day cycle makes its low near the end of the month, and before the index resumes its uptrend toward its final intermediate destination.
Because the distribution pattern above 1205 carries a potential for targets lower than 1173, there is a minimal risk that the SPX will slice through the bottom of its channel on its next correction.
FREE TRIAL SUBSCRIPTON
If precision in market timing is something which is important to you, you should consider a trial subscription to my service. It is free, and you will have four weeks to evaluate the claims made by the following subscribers:
Thanks for all your help. You have done a superb job in what is obviously a difficult market to gauge. J.D.
Unbelievable call. U nailed it, and never backed off. C.S.
I hope you can teach me about the market and the cycles. I want to be like you and be the best at it. F.J.
But don't take their word for it! Find out for yourself with a FREE 4-week trial. Send an email to ajg@cybertrails.com .
By Andre Gratian
MarketTurningPoints.com
A market advisory service should be evaluated on the basis of its forecasting accuracy and cost. At $25.00 per month, this service is probably the best all-around value. Two areas of analysis that are unmatched anywhere else -- cycles (from 2.5-wk to 18-years and longer) and accurate, coordinated Point & Figure and Fibonacci projections -- are combined with other methodologies to bring you weekly reports and frequent daily updates.
“By the Law of Periodical Repetition, everything which has happened once must happen again, and again, and again -- and not capriciously, but at regular periods, and each thing in its own period, not another’s, and each obeying its own law … The same Nature which delights in periodical repetition in the sky is the Nature which orders the affairs of the earth. Let us not underrate the value of that hint.” -- Mark Twain
You may also want to visit the Market Turning Points website to familiarize yourself with my philosophy and strategy.www.marketurningpoints.com
Disclaimer - The above comments about the financial markets are based purely on what I consider to be sound technical analysis principles uncompromised by fundamental considerations. They represent my own opinion and are not meant to be construed as trading or investment advice, but are offered as an analytical point of view which might be of interest to those who follow stock market cycles and technical analysis.
Andre Gratian Archive |
© 2005-2022 http://www.MarketOracle.co.uk - The Market Oracle is a FREE Daily Financial Markets Analysis & Forecasting online publication.


