


Stock Market Elliott Wave Count Weekend Update
Stock-Markets / Elliott Wave Theory Nov 13, 2010 - 05:07 PM GMTBy: Tony_Caldaro

 After last week’s good performance, (+3.25%), the equity market gave back some of its gains with its worse weekly performance since the second week of August. Economic reports for the week were all either positive or improving. The trade/budget deficits improved, import/export prices were positive, and consumer sentiment rose, along with wholesale inventories and weekly mortgage applications. Weekly jobless claims declined, the WLEI and M1 multiplier improved, while the monetary base held steady.
After matching the uptrend high on tuesday, however, the markets spent the rest of the week in pullback mode. For the week the SPX/DOW were -2.2%, and the NDX/NAZ were -2.3%. Asian markets were -2.4%, European markets lost 1.3%, the Commodity equity group lost 1.3%, and the DOW World index was -2.2%. Bonds were -1.2%, Crude lost 2.2%, Gold was -1.8% and the USD was 2.0% higher. Next week’s highlights include: retails sales, PPI/CPI, industrial production, and speeches from the 6th European Central Bank conference.
LONG TERM: bull market
This week we review the bull market, in the US, that has unfolded and continues to unfold. In October 2007 equities entered a 17 month bear market. The market lost 58% of its value, as measured by the SPX, and 54% in the DOW. This was the worse bear market in over seventy years in terms of percentage loss. When it concluded in March 2009 the OEW waves had formed a detailed 5-3-5 zigzag. From that SPX 667 low the market began to impulse higher. The first wave up completed in Jun09 at SPX 956. A wave 2 correction followed into Jly09 at SPX 869. The next rally took six months into Jan10 when the SPX hit 1150. This was followed by another one month correction into Feb10 and SPX 1045. The fifth wave, up from the SPX 667 low, took the market to SPX 1220 by Apr10. We labeled these waves as five Major waves completing Primary wave I of a five primary wave bull market.
After Primary wave I topped a larger correction, Primary wave II, was underway. This correction took the form of a zigzag and bottomed in Jly10 at SPX 1011. This low was very close to Major wave 4, which is typical of a bull market. Since the Jly10 low the market has rallied to new bull market highs at SPX 1227. This uptrend is Major wave 1 of Primary wave III. When it concludes, which is estimated to be in Jan11, there will be a correction to form Major wave 2. Then the market will make higher bull market highs during Major wave 3. This is how bull markets unfold.

The bull market pattern between Oct02 and Oct07 is a bit different since it was a bull market of a different wave degree. Notice how four Major waves, of a five Major wave bull market, completed early. Then Major wave 5 took three years to unfold as it continually subdivided. Also notice, each new impulsing uptrend created high highs for the bull market. This is exactly what is transpiring during this bull market. Only this time the angular rate of the bull market is steeper. Which suggests this market will reach its bull market high in a much faster time. We’re currently estimating early 2012.
MEDIUM TERM: uptrend high SPX 1227
Each uptrend of this bull market has unfolded in five Intermediate waves. Some of these waves have taken only weeks to unfold, while others have taken months. The first three uptrends of this bull market took: 3 months, 6 months and 2 months respectively. Our current uptrend is already in its fourth month, (Jly-Nov). We estimated, soon after it began, this wave would take about six months to unfold, (Jly10-Jan11). Knowing this, in advance, we knew at times the internal wave structure would be a bit difficult to track. In fact, the six month (Jly09 to Jan10), uptrend frustrated even the best of them. Thus far, this uptrend has not been that complicated.
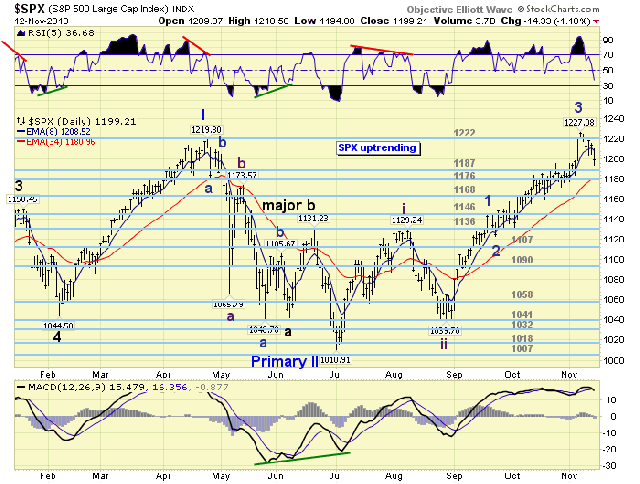
It started off with a strong kickoff rally from SPX 1011, the Primary wave II low, to SPX 1129 in Aug10. This 118 SPX point gain, (11.7%), we labeled Intermediate wave one. The pullback that followed, for the rest of August, bottomed at SPX 1040 and we labeled it Intermediate wave two. Since then the market has rallied 187 SPX points, (18.0%), to 1227. We have been tracking this rally as Intermediate wave three. At the recent high Int. wave three has nearly a 1.618 fibonacci relationship to Int. wave one. SPX 1231 is a perfect 1.618 relationship. We made note of this in last weekend’s update.
Our preferred count is the one posted on the chart below. However, we must keep in mind that the choppy market activity between mid-Oct to early-Nov was difficult to follow. After considerable thought, during that period, we opted for this count. There is another count which suggests that Intermediate wave three topped at SPX 1227 with the near 1.618 relationship to Intermediate wave one. We have this count posted on the DOW hourly chart, see link below.
Under either scenario the recent downdraft is only expected to be a pullback during an ongoing uptrend. And, the internal technicals currently support that view. Eight of the nine SPX sectors remain in uptrends, XLU the exception. Fourteen of the fifteen World indices we track remain in uptrends, Spain’s IBEX the exception. The weekly MACD continues to rise, but the RSI did get quite overbought. The market is probably setting up for another negative divergence when the uptrend does conclude.
SHORT TERM
Support for the SPX remains at 1187 and then 1176, with resistance at 1222 and then 1240. Short term momentum was very oversold at friday’s SPX 1194 low and has started to rise. We noted the potential for a pullback tuesday morning when the SPX displayed a negative RSI divergence on its retest of SPX 1227. The market declined to SPX 1204 on wednesday and then rallied to 1219. A gap down on thursday took it to SPX 1204 again and then the market rallied to 1214. Friday’s gap down, however, took it to that 1204 level again and then broke through it in the afternoon, hitting SPX 1194.
During this three day decline the market has now dropped 33 SPX points, its largest pullback since Intermediate wave three began. And, the daily RSI is now the most oversold it has been in over two months. With friday’s dip down to SPX 1194 the market entered the range of the OEW 1187 support pivot. The range of these pivots is 7 points. As long as this pivot holds support, the preferred count posted in the SPX daily chart above is in force. Should the SPX break through this pivot’s range the DOW alternate count, Intermediate wave four underway, would be the preferred count.
Should the market fail to sustain a decent rally early next week, or break lower, support for Intermediate wave four will likely occur at either the 1176, 1168 or 1146 pivots. Since Intermediate wave one concluded at SPX 1129 the pullback should not overlap that level. Int. wave one topped within the range of the OEW 1136 pivot. Which is the one directly below 1146. All these pivots are noted on the SPX daily chart in light blue. The early part of next week should give us a good idea as to what is next: a Minor wave 4 low or an Intermediate wave four low. Best to your trading!
FOREIGN MARKETS
The Asian markets were mostly lower on the week for a net loss of 2.4%. India’s BSE led the group lower -4.0% while Japan’s NIKK was +1.0%. All remain in uptrends.
The European markets were all lower losing 1.3%. Spain’s IBEX was -1.9% and Germany’s DAX was -0.3%. All remain in uptrends.
The Commodity equity group were mostly lower -1.3%. All remain in uptrends.
The DOW World index lost 2.2% on the week and remains in an uptrend.
COMMODITIES
Bonds were -1.2% on the week. As expected 10YR yields are now uptrending in the QE 0.6 environment. In the past month, yields have risen from 2.33% to 2.78%.
Crude lost 2.2% on the week, all of it and then some on friday. There is a negative RSI divergence on the daily chart after what appears to be a fifth wave in its uptrend.
Gold lost 1.8% on the week and its uptrend is also displaying a negative RSI divergence on the daily charts. Silver traded over $29 on tuesday and closed barely over $26 on friday. Platinum also tumbled after hitting an uptrend high at $1,806, it ended the week at $1,681. All are displaying negative daily RSI divergences, and the latter two negative weekly divergences as well. The last rally in gold, two days, failed to make a new high.
The USD, +2.0% on the week, appears to be uptrending. The EUR, (-2.4%), is already in a confirmed downtrend and the JPYUSD (-1.4%) is weakening as well. The Swiss CHFUSD is also downtrending.
NEXT WEEK
A busy week ahead starting on monday with Retail sales and the NY FED at 8:30, then Business inventories at 10:00. On tuesday, we’ll have the PPI report, Industrial production and the NAHB housing index. Wednesday, the CPI and building starts/permits. On thursday, weekly Jobless claims, BEA leading indicators and the Philly FED. Friday is Options expiration. FED chairman Bernanke will be in Germany towards the end of the week, and will give speeches on friday before the US opens for trading. Best to your week!
CHARTS: http://stockcharts.com/def/servlet/Favorites.CServlet?obj=ID1606987
By Tony Caldaro
http://caldaroew.spaces.live.com
After about 40 years of investing in the markets one learns that the markets are constantly changing, not only in price, but in what drives the markets. In the 1960s, the Nifty Fifty were the leaders of the stock market. In the 1970s, stock selection using Technical Analysis was important, as the market stayed with a trading range for the entire decade. In the 1980s, the market finally broke out of it doldrums, as the DOW broke through 1100 in 1982, and launched the greatest bull market on record.
Sharing is an important aspect of a life. Over 100 people have joined our group, from all walks of life, covering twenty three countries across the globe. It's been the most fun I have ever had in the market. Sharing uncommon knowledge, with investors. In hope of aiding them in finding their financial independence.
Copyright © 2010 Tony Caldaro - All Rights Reserved Disclaimer: The above is a matter of opinion provided for general information purposes only and is not intended as investment advice. Information and analysis above are derived from sources and utilising methods believed to be reliable, but we cannot accept responsibility for any losses you may incur as a result of this analysis. Individuals should consult with their personal financial advisors.
© 2005-2022 http://www.MarketOracle.co.uk - The Market Oracle is a FREE Daily Financial Markets Analysis & Forecasting online publication.