


U.S. Dollar Rally Possible, Reduce Exposure to Gold, Silver and Copper
Currencies / US Dollar Nov 08, 2010 - 11:59 AM GMTBy: Chris_Ciovacco

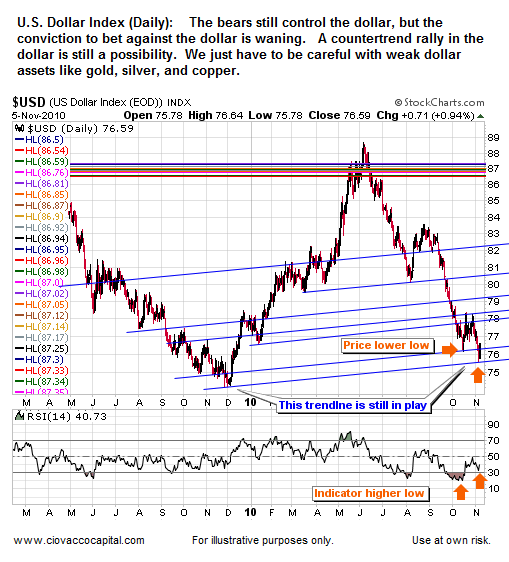
 While the long-term fundamentals related to the U.S. dollar remain bearish, Friday’s significant rally in the greenback leaves the door open for a possible countertrend rally. The conditions highlighted below may be cleared in a matter of days, but as of the close on November 5th the dollar remains susceptible to a surprise countertrend rally.
As shown below, a short-term bullish divergence remains in place between price and the dollar’s relative strength index. The condition can be cleared if RSI drops over the next few trading sessions. A trendline from December of 2009 is also in a position to lend possible support to the dollar (see blue line).
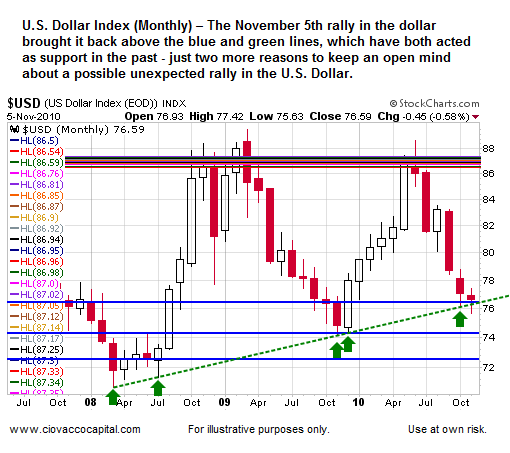
If we move to a broader timeframe using a monthly chart, we see the trendline extends all the way back to 2008 (see green dotted line). A trendline on a monthly chart is more significant than one on a short-term daily chart.
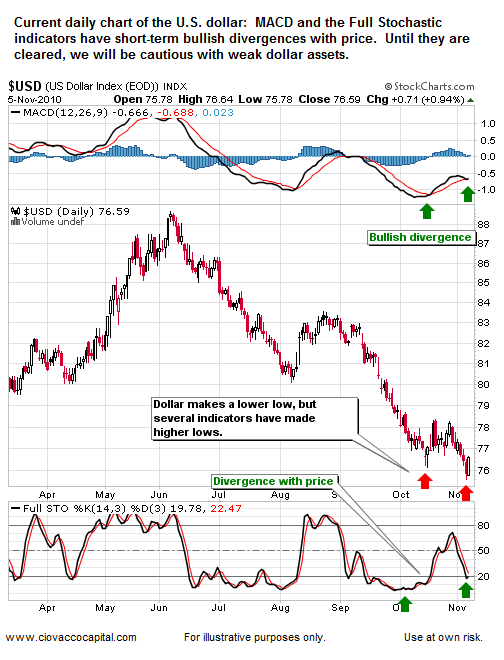
The dollar’s daily chart is also showing some potentially bullish divergences. While the U.S. Dollar Index recently made a lower low, several technical indicators have not followed.
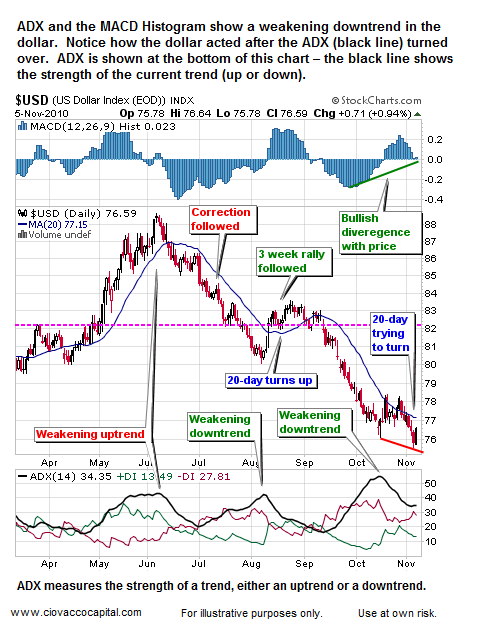
The chart below contains several indicators that continue to support a possible short-term rally in the dollar. ADX (shown at the bottom of the chart) is of particular concern. According to Dr. Alexander Elder in Trading For A Living:
When ADX rallies above both directional lines (red and green), it identifies an overheated market. When ADX (black line) turns down from above both directional lines (red and green), it shows that the major trend has stumbled. It is a good time to take profits. If you trade multiple contracts, you definitively want to take partial profits.
Notice how well Dr. Elder’s comments relate to the recent action in the U.S. dollar. The black ADX line recently turned down from above both the red and green directional lines, which is a textbook red flag relative to a possible change in trend from down to up.
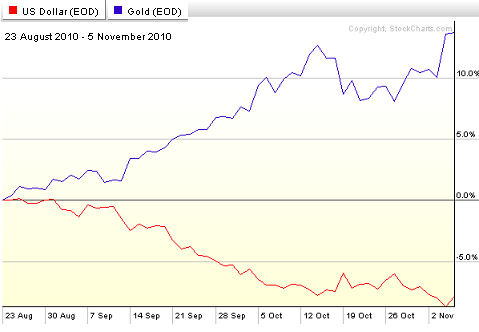
Many believe, including us at CCM, the current rally off the summer lows was sparked mainly by the expectation the Fed would print more money. The chart below shows as the U.S. dollar (red line) began to weaken again in August of 2010, weak dollar assets, like gold (blue line), began to rally. If the dollar rallies, then weak-dollar assets may consolidate for a time or experience pullbacks. Our concern is correlation risk between the dollar, gold, silver, oil, and copper.
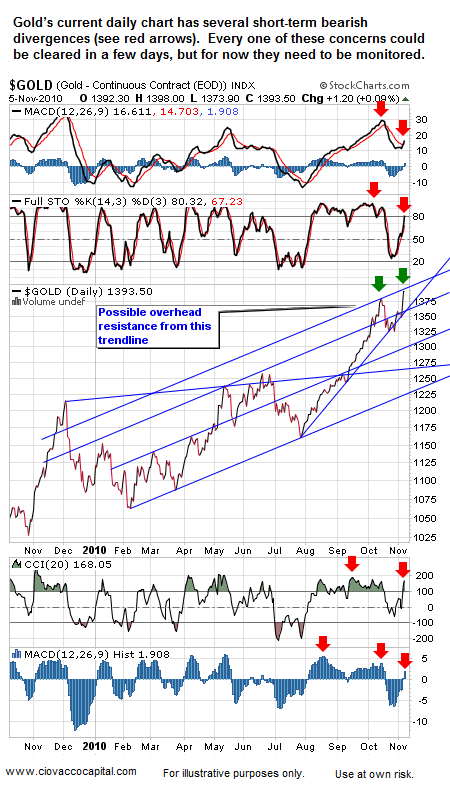
Gold has rallied again recently, but not in a convincing manner thus far. Divergences and overhead trendline resistance (blue line), could come into play, especially if the dollar rallies.
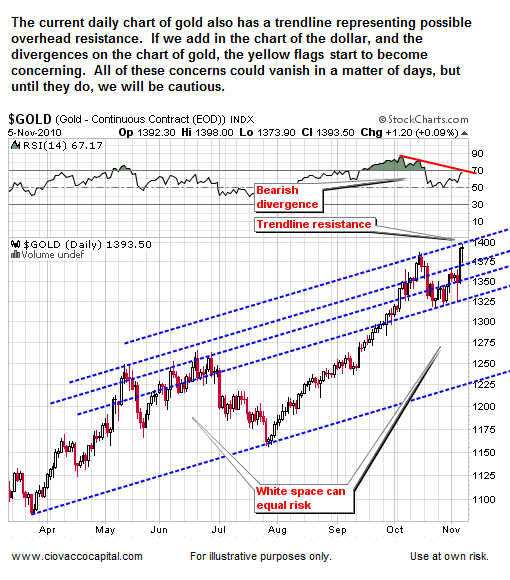
Below is a similar look highlighting the trendlines in gold and the short-term divergence in RSI which has not yet been cleared.
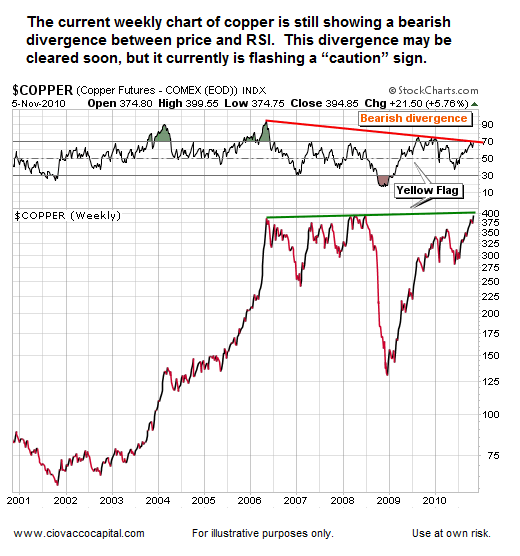
Our concerns extend to other inflation-protection assets, like copper. These divergences do not mean copper and gold cannot advance, but they do mean the downside risks have increased relative to the upside potential, as least for the short-term.
Could the dollar continue to fall? Yes. Could gold, silver, copper, and oil continue to rise? Yes, but we have to decide how much risk we are willing to take in order to seek additional gains. While we still hold gold, silver, and copper, our decision to reduce our exposure to these assets was based on deteriorating short-term, risk-reward profiles. When the conditions outlined above are no longer present and the risk-reward profiles improve, we will revisit our exposure to inflation-friendly assets. Additional short-to-intermediate-term concerns related to gold are covered in Short-Term Concerns Remain for Gold.
By Chris Ciovacco
Ciovacco Capital Management
Copyright (C) 2009 Ciovacco Capital Management, LLC All Rights Reserved.
Chris Ciovacco is the Chief Investment Officer for Ciovacco Capital Management, LLC. More on the web at www.ciovaccocapital.com
Ciovacco Capital Management, LLC is an independent money management firm based in Atlanta, Georgia. As a registered investment advisor, CCM helps individual investors, large & small; achieve improved investment results via independent research and globally diversified investment portfolios. Since we are a fee-based firm, our only objective is to help you protect and grow your assets. Our long-term, theme-oriented, buy-and-hold approach allows for portfolio rebalancing from time to time to adjust to new opportunities or changing market conditions. When looking at money managers in Atlanta, take a hard look at CCM.
All material presented herein is believed to be reliable but we cannot attest to its accuracy. Investment recommendations may change and readers are urged to check with their investment counselors and tax advisors before making any investment decisions. Opinions expressed in these reports may change without prior notice. This memorandum is based on information available to the public. No representation is made that it is accurate or complete. This memorandum is not an offer to buy or sell or a solicitation of an offer to buy or sell the securities mentioned. The investments discussed or recommended in this report may be unsuitable for investors depending on their specific investment objectives and financial position. Past performance is not necessarily a guide to future performance. The price or value of the investments to which this report relates, either directly or indirectly, may fall or rise against the interest of investors. All prices and yields contained in this report are subject to change without notice. This information is based on hypothetical assumptions and is intended for illustrative purposes only. THERE ARE NO WARRANTIES, EXPRESSED OR IMPLIED, AS TO ACCURACY, COMPLETENESS, OR RESULTS OBTAINED FROM ANY INFORMATION CONTAINED IN THIS ARTICLE. PAST PERFORMANCE DOES NOT GUARANTEE FUTURE RESULTS.
Chris Ciovacco Archive |
© 2005-2022 http://www.MarketOracle.co.uk - The Market Oracle is a FREE Daily Financial Markets Analysis & Forecasting online publication.