


Gold and SP500 Bull Markets Continue To Leave Investors Behind
Stock-Markets / Stock Markets 2010 Nov 03, 2010 - 10:02 AM GMTBy: David_Banister

In my recent forecast updates for my subscribers and also in my free articles online, I have expounded on the virtues of Elliott Wave Theory, which I use as my linchpin for my short and long term views. To wit, back in August 2009 I made it clear that we would enter a five year period of a massive move up in both Gold and Gold Stocks. Gold was $900 an ounce at the time, and is now at $1360 an ounce. I made that forecast based on human behavioral patterns that go back centuries.
Crowds love to all act like a swarm of bees flying together. Everyone hates stocks or sectors when they are down, and the crowd loves them when they are up or going up. Investors like to chase stocks and sectors when they are up high and running near parabolic, but they don't like to buy large dips or consolidations ahead of moves. Once you learn that Elliott Wave patterns and a few other indicators sprinkled in can give you a heads up on when the crowd is about to jump in, you can basically front run the crowds.
I digress and go back to the Gold Bull Market. The reason I knew in August of 2009 that from $900 Gold we would enter a five year "massive" Bull Run is due to crowd patterns. To refresh, I see Gold as being in a Fibonacci 13 year cycle up that started in 2001. The first five years not too many investors participate in the Bull Run because the prior 20 did nothing. By the time everyone realized in 2006 that Gold mutual funds had compounded 30% a year for five years, it was too late to jump in. Of course, that is when everyone started buying Gold mutual funds and stocks. The problem is the first move was over, and we had 3 Fibonacci years of chop with no net gains. The crowd gives up around the summer of 2009, and that is when I forecasted a huge five year move to come. So far Gold is up over 50% in 13 months and Gold Stocks are up well north of that. The junior stocks started expanding in volume and price months ago, and that should have been yet another wake up call to investors.
Near term in Gold I'm looking for this current power Elliott wave to land around $1485-$1492 before a strong correction, and the recent pivot at $1312 was yet another short term bottom which will be followed by the last leg up since the $1155 lows this summer. Investors are now waking up and buying Gold and Gold stocks, and this is part of the recognition period during the last 5 years of the 13 year cycle when more and more participants get involved. This is why this Gold Bull is just warming up and by the time it peaks out, it will be like 1999 in Tech stocks. The demand overseas for gold and obviously in China is likely to continue for many years to come, don't be fooled by the various wave dips in sentiment.
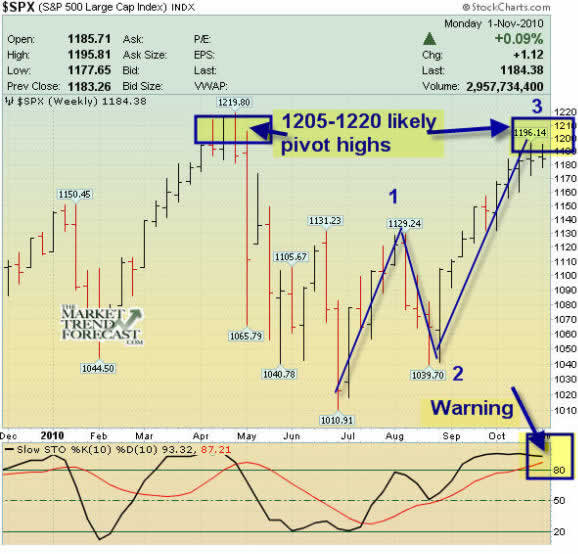
The SP 500 on the other hand is very similar since the March 2009 lows. The Bears have continued to focus on Jobs reports and other ephemeral data and not the big picture. My opinion is the great bear cycle ended in March 2009 at 666 on the SP 500, at least for a several year cycle up. When we hit 666 it was an exact 61.8% Fibonacci re-tracement of the 1974 SP 500 lows to the 2000 SP 500 highs. It took about 8-9 years to correct that 26 year move, and the pattern fits with a "wave 2" pessimistic Elliott Wave bottom. That is why the move since 666 has been stunning, because nobody sees it coming. The correction we had this summer I forecast in mid-April and ended on July 1st at 1010 on the SP 500. At the level of 1010, we had a 38% Fibonacci re-tracement of the March 09 to April 2010 13 Fibonacci month rally, and a 38% re-tracement of the 2007 highs to 2009 lows. Those types of patterns are not random and in fact are big clues to get long the market. The problem is those patterns are hidden amongst the noise of the markets, CNBC, and all of that useless data. Currently we are in a 3rd Elliott wave up which began at the 1040 SP 500 pivot, and my forecast since has been for 1205-1220 before a corrective 4th wave down. Before it's all over, the SP 500 may well test the 2007 highs on this new cycle up from March 2009.
Subscribers to my website get weekly updates and regular intra-week commentary as needed, please consider subscribing. Today we are offering a 2 day only 12 months for the price of 6 months special in celebration of the US mid-term elections today. Enter "1246month" in the coupon field. Your price will automatically drop to the semi-annual price. You may follow us on twitter at www.twitter.com/activetrading
Dave Banister
CIO-Founder
Active Trading Partners, LLC
www.ActiveTradingPartners.com
TheMarketTrendForecast.com
Dave Banister is the Chief Investment Strategist and commentator for ActiveTradingPartners.com. David has written numerous market forecast articles on various sites (SafeHaven.Com, 321Gold.com, Gold-Eagle.com, TheStreet.Com etc. ) that have proven to be extremely accurate at major junctures.
© 2010 Copyright Dave Banister- All Rights Reserved
Disclaimer: The above is a matter of opinion provided for general information purposes only and is not intended as investment advice. Information and analysis above are derived from sources and utilising methods believed to be reliable, but we cannot accept responsibility for any losses you may incur as a result of this analysis. Individuals should consult with their personal financial advisors.
© 2005-2022 http://www.MarketOracle.co.uk - The Market Oracle is a FREE Daily Financial Markets Analysis & Forecasting online publication.