


Stock Market Cycle Turning Points Analysis 7th October 2007
Stock-Markets / US Stock Markets Oct 07, 2007 - 10:54 PM GMTBy: Andre_Gratian

 Current Position of the Market.
SPX: Long-Term Trend - The 12-yr cycle is approaching its mid-point and some of its dominant
components are topping and should soon restrain the bullish effect of the 4.5-yr. This could lead to
another period of consolidation in 2008 with an eventual bull market top in 2009-2010.
SPX: Intermediate Trend - The intermediate-term trend has been up since the 4.5yr cycle low in
August, but it could shortly be interrupted by a short-term correction.
Analysis of the short-term trend is done on a daily basis with the help of hourly charts. It is an important adjunct to the analysis of daily and weekly charts which determines the course of longer market trends.
Overview
In the past two weeks, major equity indices followed the lead of the Nasdaq 100 and made new bull
market highs. The SPX, OEX, Dow Industrials and NYSE composites also made all-time highs.
There can now be no question that the bull market from October 2002 is still alive and well and
destined to go higher.
In the past two weeks, major equity indices followed the lead of the Nasdaq 100 and made new bull market highs. The SPX, OEX, Dow Industrials and NYSE composites also made all-time highs. There can now be no question that the bull market from October 2002 is still alive and well and destined to go higher.
One laggard is the Russell 2000 which had a good move in the past two weeks, but came a little shy of its July High. Another laggard which is undoubtedly closely watched by the Dow Theory advocates is the Dow Jones Transportation index. Of course, it is to some extent being affected by the price of oil which has recently climbed to an all-time high.
With recent economic reports suggesting that the worst of the credit crunch crisis may be over, financial stocks are beginning to recover. After a seven-month decline, the Dow Jones REIT index is now back in an uptrend. The Banking index is still in a base but looks as if it may be getting ready to break out of it.
What’s Ahead?
Momentum:
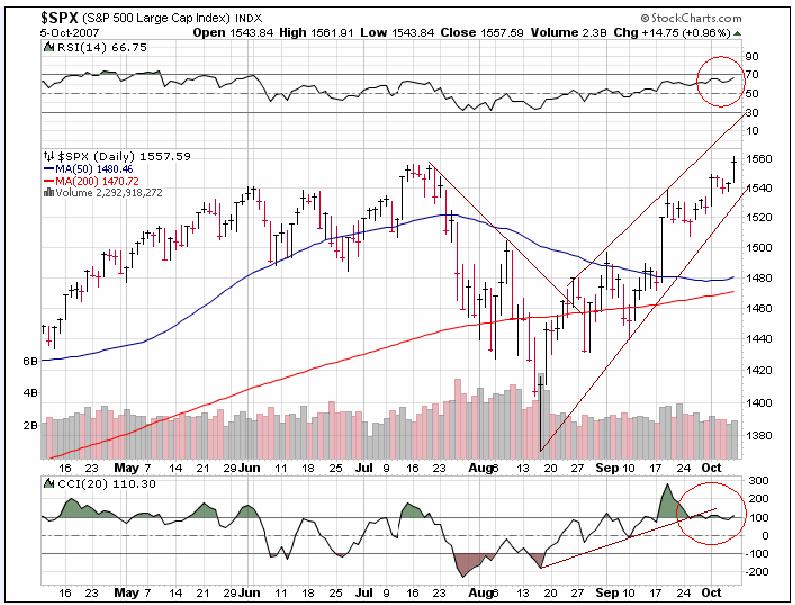
The following chart of the daily SPX (Courtesy of StockCharts) is beginning to show signs of
momentum loss. Price is starting to pull away from the top of its channel establishing what could
eventually turn out to be a wedge pattern.
The loss of momentum is best seen in the bottom indicator (CCI - Commodity Channel Index). After reaching an overbought position, it has pulled back and is now moving sideways while the SPX is moving higher.
A red flag is also being raised by the fact that volume is decreasing as the advance progresses, and the RSI (top) is very close to reaching an overbought level.
These are signs that bear watching. On the other hand, stocks are entering the strongest seasonal period of the year and this should provide a cushion if a consolidation does take place.
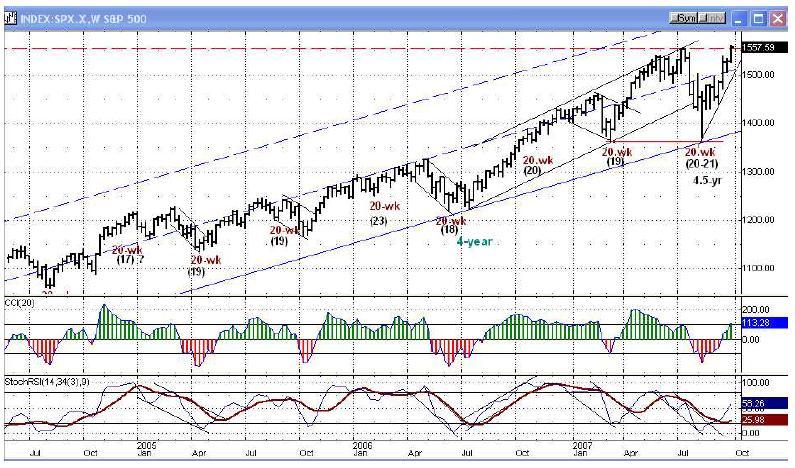
On the following weekly chart of the SPX, I have added the CCI so that it can be compared to the one on the daily chart. The weekly indicators are still moving up nicely and are not showing any sign of deceleration.
Last week, the index reached an all-time high. Breaking above the former high will trigger some projections that will be discussed later, but for now, we can see that after bouncing off the lower long-term uptrend line, the price has now moved into the upper half of its long-term rising channel. This is a sign of strength.
Everything on this chart suggests that higher prices lie ahead.
Cycles
We are in a time period which has caused some analysts to predict a "crash" during the month of October based on the 7th year of the decennial pattern. Instead, some of the indices have moved to new highs. With the 4.5-yr cycle bottoming in August, the long-term cycle configuration does not look capable of supporting a crash scenario. But it is possible that the 12-mo cycle bottom is still ahead of us and could cause a short-term decline. Historically, this cycle has made its low in the September-November time frame. With a number of technical indicators suggesting that a shortterm top may be near, it is probably best to assume that the 12-mo low is still ahead.
The nest of short-term cycles mentioned in the last newsletter did restrain the upward motion for a couple of weeks and helped propel the SPX to a new high after they had bottomed.
The next cycle to affect the market will be the 10-week cycle which is due to make its low toward the end of next week. This should cause another short-term pull-back and be followed by a move up to the target discussed in the next section. After it is reached or approximated, there should be another correction, presumably caused by the bottoming of the 12-mo cycle.
Projections
When the SPX moves decisively above its former high, it will trigger Fibonacci projections into the 1600s. Near-term, there are two (Fibonacci and Point & Figure) targets which lie directly ahead. The first, 1560-1565, was reached on Friday. The other is 1580-1585.
The first target is likely to be the 10-week cycle high. The ideal scenario would now be for a pullback to take place into the cycle low toward the end of next week, and then for the index to move up for a few days to its next projection zone. When that target is reached or only approximated, the SPX will be most vulnerable to another correction. Momentum, volume, and breadth indicators are all signaling that a correction is due shortly and this would be the most logical time frame and level for it to begin.
Breadth
The NYSE McClellan oscillator has remained positive for seven weeks. This has enabled the
Summation index to rise well into positive territory, but it is still shy of its former high and, in that
sense, it is under-performing price. The same is true of the cumulative advance/decline line and of
the new highs/new lows index.
The Nasdaq Summation index is quite a bit weaker than the NYSE and is still negative.
We must be careful not to make too much of this negative divergence. With a long-term cycle having just made its low, the prospects for a continued uptrend are very good and these divergences may disappear a few months from now as the indices catch up with price.
We must be careful not to make too much of this negative divergence. With a long-term cycle having
just made its low, the prospects for a continued uptrend are very good and these divergences may
disappear a few months from now as the indices catch up with price.
However, the negative divergence which is showing in the McClellan oscillator is of concern for the immediate future.
Market Leaders & Sentiment
The NDX has now cleared its July high by a wide margin, while the SPX is just barely above it. As you can see on the chart below (courtesy of StockCharts), this has caused the ratio of the two indices to soar to a new high. We therefore continue to have strong positive divergence registering between them, and past history tells us that this is how it should be in a bull market.
GE is slowing down, but this is due to its own chart pattern. The stock is at the top of an intermediate channel which is providing resistance and it probably needs to consolidate. There is no sign that an important reversal is at hand. The ISEE (put/call ratio indicator) is not at a level associated with important tops.
Summary
By rising to new all time highs, several equity indices are confirming that the bull market from October 2002 is still intact. However, technical indicators are signaling that a short-term top is near and that a correction is due. This is supported by short and intermediate-term cycles.
The following are examples of unsolicited subscriber comments:
What is most impressive about your service is that you provide constant communication with your subscribers. I would highly recommend your service to traders. D.A.
Andre, You did it again! Like reading the book before watching the movie! B.F.
I would like to thank you so much for all your updates / newsletters. as i am mostly a short-term trader, your work has been so helpful to me as i know exactly when to get in and out of positions. i am so glad i decided to subscribe to turning points. that was one of the best things i did ! please rest assured i shall continue being with turning points for a long while to come. thanks once again ! D.P.
But don't take their word for it! Find out for yourself with a FREE 4-week trial. Send an email to ajg@cybertrails.com .
By Andre Gratian
MarketTurningPoints.com
A market advisory service should be evaluated on the basis of its forecasting accuracy and cost. At $25.00 per month, this service is probably the best all-around value. Two areas of analysis that are unmatched anywhere else -- cycles (from 2.5-wk to 18-years and longer) and accurate, coordinated Point & Figure and Fibonacci projections -- are combined with other methodologies to bring you weekly reports and frequent daily updates.
“By the Law of Periodical Repetition, everything which has happened once must happen again, and again, and again -- and not capriciously, but at regular periods, and each thing in its own period, not another’s, and each obeying its own law … The same Nature which delights in periodical repetition in the sky is the Nature which orders the affairs of the earth. Let us not underrate the value of that hint.” -- Mark Twain
You may also want to visit the Market Turning Points website to familiarize yourself with my philosophy and strategy.www.marketurningpoints.com
Disclaimer - The above comments about the financial markets are based purely on what I consider to be sound technical analysis principles uncompromised by fundamental considerations. They represent my own opinion and are not meant to be construed as trading or investment advice, but are offered as an analytical point of view which might be of interest to those who follow stock market cycles and technical analysis.
Andre Gratian Archive |
© 2005-2022 http://www.MarketOracle.co.uk - The Market Oracle is a FREE Daily Financial Markets Analysis & Forecasting online publication.