


Silver 30 Year Resistance Breakout, Big Profit Opportunity Against Gold
Commodities / Gold and Silver 2010 Oct 22, 2010 - 04:55 AM GMT

 In our eye’s, when it comes to investing “Relative Value” is ‘everything’! Why? Because currencies are controlled and manipulated by governments so “Price” (measuring an asset’s value with a currency) cannot be relied upon.
Where do we see some relative value these days? Let us first clarify our point using a few historical examples and then we will provide some insight into today’s market.
In past articles we clearly illustrated the relative value of the “Dow Jones to Silver” and the “Dow Jones to Gold”.
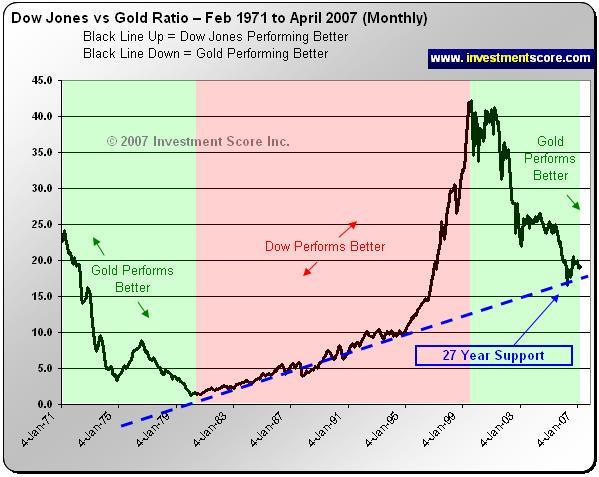
In the above chart, when the Dow Jones increases in value relative to gold the ratio (black line) heads up and when the metal outperforms the Dow Jones, the black line heads down.
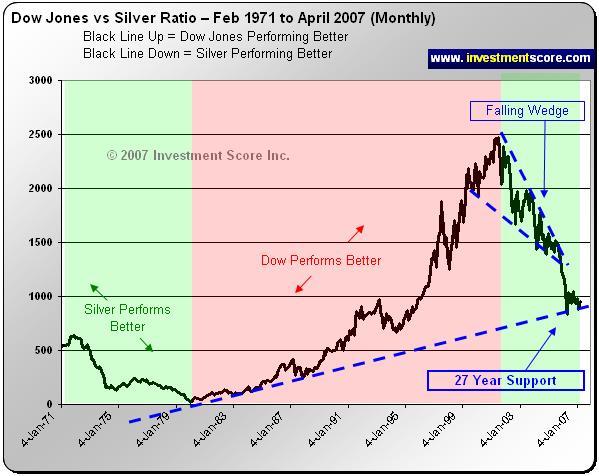
When we initially published the above charts back in 2007, we were suggesting that we expected those ratios to break their 27 year support line which would cause Silver and Gold to rise in value relative to the Dow Jones (US stocks). Since this period of time the following took place:
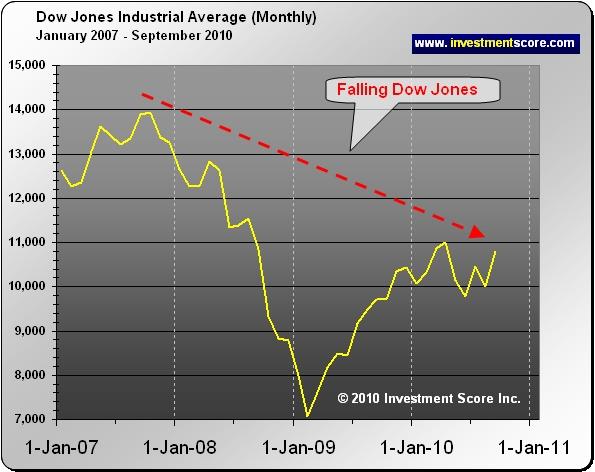
From the above we can clearly see that when the ratio’s 27 year support lines were broken, the price performance of silver and gold trended up and the Dow Jones trended down. The above insight was extremely profitable.
Currently we see another relative value opportunity.
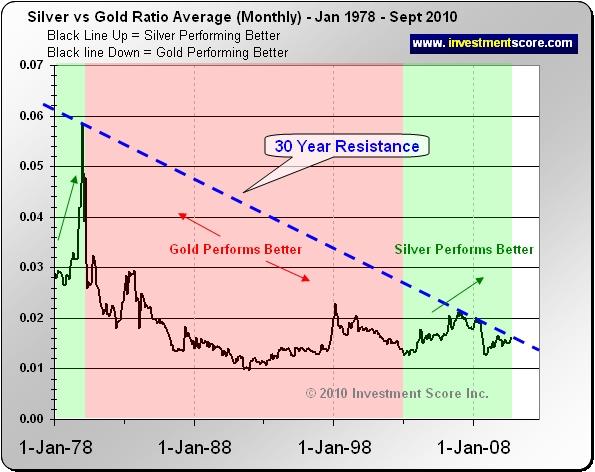
The above monthly chart suggests that relative to Gold, Silver may be just about to break to the upside of a 30 year undervalued resistance line. Similar to the Dow vs. Silver ratio examples above, this could turn out to be quite bullish for silver. History would suggest that the longer a support or resistance line has been in place, the greater the significance it will hold once broken.
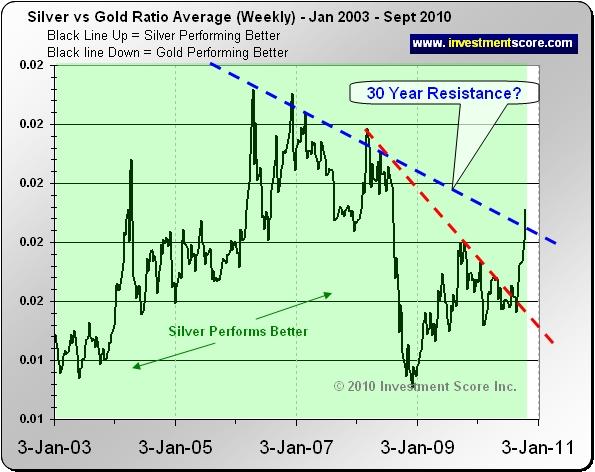
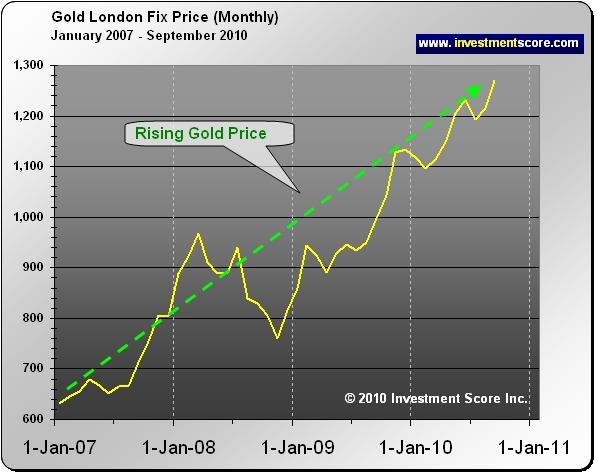
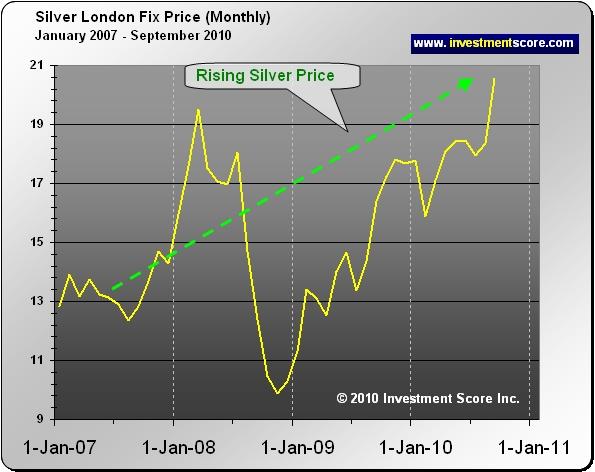
The above weekly chart provides a little bit more detail in the short term which suggests that relative to Gold, Silver may have just broken to the upside of this same 30 year undervalued resistance line. In simple terms this means that Silver may greatly outperform Gold in the coming months or years. Logically this makes sense as gold has been hitting new ‘all time’ highs since early 2008 while silver is still well below it’s all time high set back in 1980.
This insight suggests that gold investors may want to trade some of their holdings into Silver as this market may have some serious potential for growth. Historically when silver has increased in value, it has done so like a ‘rocket’. This latest development could be big news for the price of silver and silver investors.
At investmentscore.com we like to focus on the big picture trends in the markets as we believe this is where the “big money” is made. Obviously in the short term anything can happen but we find a little more stability and predictable trends in the “big picture” and using “relative value” analysis. Visit investmentscore.com to sign up for our free newsletter, read more articles and learn more about our unique and proprietary strategy.
At investmentscore.com we look at investments relative to various markets in order to gain a unique perspective to their “Value” instead of their “Price”. We believe it is a common mistake for investors to be misguided by “price movement” instead of by true value. At the end of the day understanding “Value” is where wealth can be created and stored as “Price” can be greatly distorted by the constant fluctuations of currencies. To learn more about our strategies and to sign up for our free newsletter please visit us at www.investmentscore.com.
By Michael Kilback
Investmentscore.com
Investmentscore.com is the home of the Investment Scoring & Timing Newsletter. Through our custom built, Scoring and Timing Charts , we offer a one of a kind perspective on the markets.
Our newsletter service was founded on revolutionary insight yet simple principles. Our contrarian views help us remain focused on locating undervalued assets based on major macro market moves. Instead of comparing a single market to a continuously moving currency, we directly compare multiple major markets to one another. We expect this direct market to market comparison will help us locate the beginning and end of major bull markets and thereby capitalize on the largest, most profitable trades. We pride ourselves on cutting through the "noise" of popular opinion, media hype, investing myths, standard over used analysis tools and other distractions and try to offer a unique, clear perspective for investing.
Disclaimer: No content provided as part of the Investment Score Inc. information constitutes a recommendation that any particular security, portfolio of securities, transaction or investment strategy is suitable for any specific person. None of the information providers, including the staff of Investment Score Inc. or their affiliates will advise you personally concerning the nature, potential, value or suitability or any particular security, portfolio of securities, transaction, investment strategy or other matter. Investment Score Inc. its officers, directors, employees, affiliates, suppliers, advertisers and agents may or may not own precious metals investments at any given time. To the extent any of the content published as part of the Investment Score Inc. information may be deemed to be investment advice, such information is impersonal and not tailored to the investment needs of any specific person. Investment Score Inc. does not claim any of the information provided is complete, absolute and/or exact. Investment Score Inc. its officers, directors, employees, affiliates, suppliers, advertisers and agents are not qualified investment advisers. It is recommended investors conduct their own due diligence on any investment including seeking professional advice from a certified investment adviser before entering into any transaction. The performance data is supplied by sources believed to be reliable, that the calculations herein are made using such data, and that such calculations are not guaranteed by these sources, the information providers, or any other person or entity, and may not be complete. From time to time, reference may be made in our information materials to prior articles and opinions we have provided. These references may be selective, may reference only a portion of an article or recommendation, and are likely not to be current. As markets change continuously, previously provided information and data may not be current and should not be relied upon.
Investmentscore.com Archive |
© 2005-2022 http://www.MarketOracle.co.uk - The Market Oracle is a FREE Daily Financial Markets Analysis & Forecasting online publication.