


Stock Market Weekend Review
Stock-Markets / Stock Markets 2010 Oct 10, 2010 - 08:04 AM GMTBy: Mike_Paulenoff

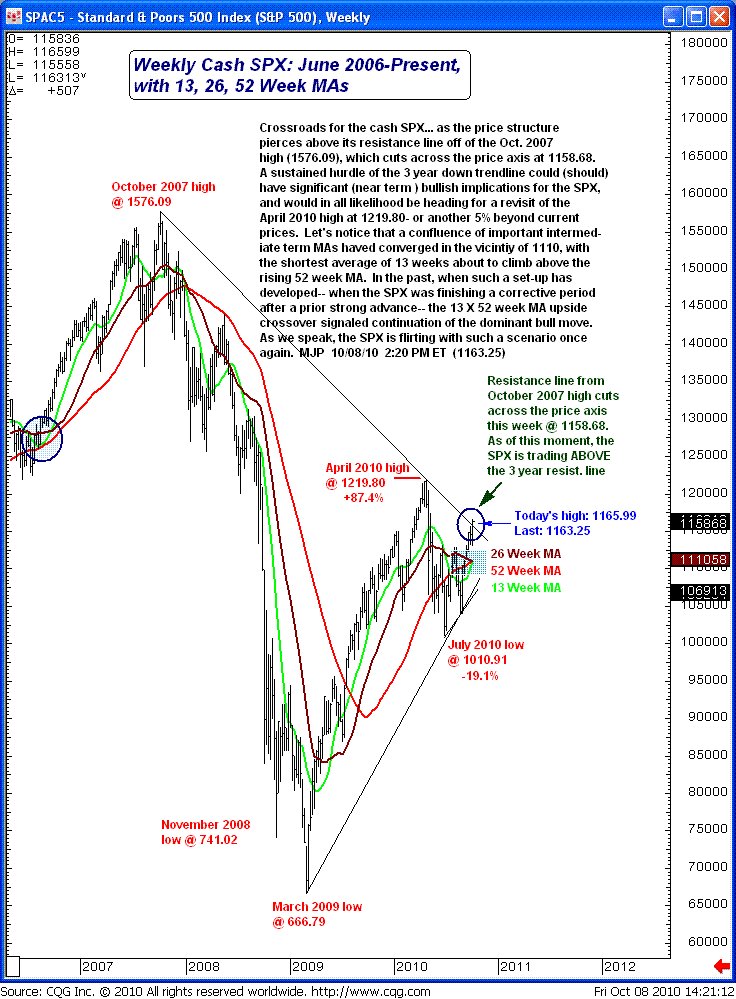
The S&P 500 is at a crossroads as the price structure pierces above its resistance line off of the October 2007 high (1576.09), which cuts across the price axis at 1158.68. A sustained hurdle of the 3-year down trendline could (should) have significant near-term bullish implications for the SPX, and would in all likelihood be heading for a revisit of the April 2010 high at 1219.80 -- or another 5% beyond current prices.
Let's notice that a confluence of important intermediate-term moving averages have converged in the vicinity of 1110, with the shortest average of 13 weeks about to climb above the rising 52-week moving average. In the past, when such a set-up has developed -- when the SPX was finishing a corrective period after a prior strong advance -- the 13 x 52 week moving average upside crossover signaled continuation of the dominant bull move. As we speak the SPX is flirting with such a scenario once again.
Sign up for a free 15-day trial to Mike's ETF & Stock Trading Diary today.
By Mike Paulenoff
Mike Paulenoff is author of MPTrader.com (www.mptrader.com), a real-time diary of his technical analysis and trading alerts on ETFs covering metals, energy, equity indices, currencies, Treasuries, and specific industries and international regions.
© 2002-2010 MPTrader.com, an AdviceTrade publication. All rights reserved. Any publication, distribution, retransmission or reproduction of information or data contained on this Web site without written consent from MPTrader is prohibited. See our disclaimer.
Mike Paulenoff Archive |
© 2005-2022 http://www.MarketOracle.co.uk - The Market Oracle is a FREE Daily Financial Markets Analysis & Forecasting online publication.