


Stock and Financial Markets Sober Analysis
Stock-Markets / Financial Markets 2010 Sep 29, 2010 - 06:06 AM GMTBy: Brian_Bloom

 It is an unarguable fact that the world economy has become moribund against a background of overpopulation and environmental degradation.
That the gold price is rising in the face of such a fact – and against a background where markets are not showing signs of impending panic – is highly significant.
*****
The weekly chart below, of the Dow Jones Industrial Index (courtesy stockcharts.com), is signalling that (at best) we can expect sideways movement in the index for the foreseeable future or (at worst) there might be an intermediate term fall in the index to around 8,750.
Why?
Volume patterns are clearly showing an absence of buying pressure – implying that recent price behaviour has been more a function of “trader” behaviour than of “investor” behaviour.
Readers’ attention is drawn to the following:
- Falling prices on falling volume (at A and B)
- Rising volume as selling pressure came in at the culmination of A (see green arrows)
- Falling prices on falling volume (at C and D)
- A minor rally following the one week’s selling pressure at the culmination of C and the subsequent minor buying pressure that emerged
- Rising prices on falling volume (At F and E)
- The RSI oscillator is approaching overbought territory even as the index itself still languishes below the peak price at the commencement of the C movement
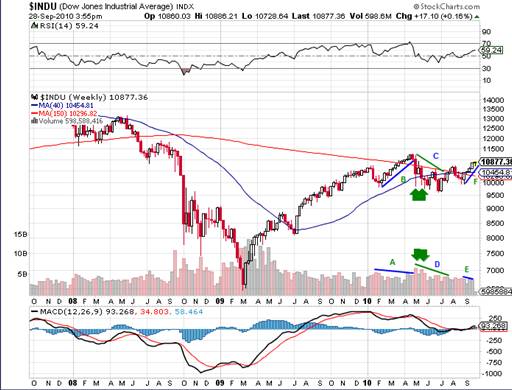
Why is this analyst drawing attention to the possibility of a fall to 8750?
Because the rise in prices to the top of the “B” wave could be argued by some to be the “Head” of a Head and Shoulders Reversal pattern. Importantly, rising volume on the left hand shoulder was absent and, therefore, there is a low (but still finite) probability that this is in fact a reversal pattern.
Interim conclusion #1
The recent analyst excitement following the upside penetration by the 40 week moving average of the Industrial index of its 150 week moving average is more reflective of a temporary pause in downside movement in share prices than an indication of bullish times ahead. It has been the result of trading activity as opposed to investor activity.
For several years now, this analyst has been suggesting that what the world economy is experiencing is more reflective of a coming paradigm shift in thinking than of a conventional cyclical downturn associated with the Kodrat’eff (and Schumpeter and others) Long Wave.
There are essentially two schools of economic thought and, in this analyst’s view, both are flawed.
The Keynesian school argues that “money supply” is the driver of the economy and, in times of cooling economic activity, deficit spending will kick start it again. This behaviour has been in place since the Reagan years and the net result has been the emergence of a debt mountain.
The Austrian school argues that “the market” should be allowed to breathe in and out without interference and that mindlessly throwing money at the economy will result in nothing other than malinvestment. A corollary to this school of thought is that there needs to be an external discipline exerted on banker behaviour in the form of formal constraints regarding the quantum of money in circulation. Logically (it is argued by growing number of people) the most sensible constraint will be a gold standard in some form.
The reason this school of thought is flawed does not revolve around any flaw in logic. It devolves to the inappropriateness of its base assumption – which, essentially, is founded on the “ceteris paribus” approach. Everything else must remain constant.
The problem – in this analyst’s view – is that very few people are yet prepared to face up to the fact that ceteris is most certainly not paribus. The “solid” ground on which the world economic infrastructure has been built has been shifting. More accurately, the foundations upon which the old-order world economy has been structured are no longer standing on solid ground. This being the case, THE GAME HAS CHANGED!
Let’s go back to base principles. What is “the game”?
The game revolves around human ingenuity being applied to natural resources with the objective of adding value that will become so attractive to others that they will be prepared to trade their value add for your value add.
Along the way, to effect greater efficiencies in the game, a common basis of valuation emerged and this common basis became known as a “medium of exchange”.
Along the way, some people came to believe that, if they could control the medium of exchange, they could control the game.
WRONG!!
The game is not about media of exchange. It is about value add. The winner of the game is he/she who can add the most value at the least cost – and thereby make the most profit. The “scorecard” of success is expressed in terms of accumulated profits which are tangibly reflected in the amount of medium of exchange that can be accumulated – the bank balance and other fixed assets.
The game itself, therefore, is about applying a combination of human ingenuity and energy to naturally occurring resources.
However, energy is really an magnifier which can be used to increase the “power” and “impact” of human ingenuity.
At the end of the day, therefore, the economic well-being of any individual or society is driven by ingenuity and the will/motivation to apply this ingenuity.
Interim Conclusion #2
The economic game is about brainpower and the motivation to apply it, not about media of exchange.
As an aside, therefore:
Third world countries are typically poor because:
- They lack ingenuity, and/or
- They lack the motivation to apply their ingenuity, or
- They lack the opportunity to apply their ingenuity, regardless of their level of motivation.
That is why no amount of money thrown at Third World countries will ever raise the standards of living of the people living there.
Okay, now that we have validated what the game is all about, let’s get back to the here and now. Why is the game changing?
The earth’s resources are “scavenged” from its surface. The water on its surface is applied to the soil on its surface to grow food. The energy that is extracted from immediately below the surface is applied to the minerals that are extracted from immediately below the surface to create products.
The “problems” are threefold:
- Supplies of energy and minerals that are closest to the surface are waning and it is requiring more energy to extract more minerals from deeper levels, and.
- In the act of doing this, the environment has become polluted, and
- The populations of less ingenious people have grown disproportionately to the populations of ingenious people.
Question: How will a move from fiat currencies to a gold standard address these three problems?
Answer: It won’t
“But, the gold price has been rising” you argue. Look at the chart below (courtesy stockcharts.com)
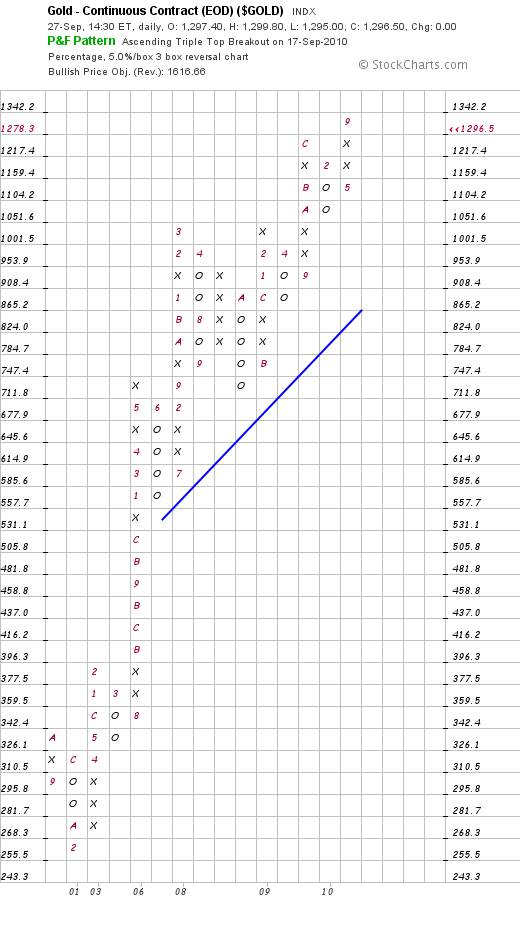
“This chart shows that the gold price can be expected to rise to $1600 an ounce” you argue. “Clearly, the world is moving to embrace gold as a store of value and as a currency of last resort.”
This analyst’s response:
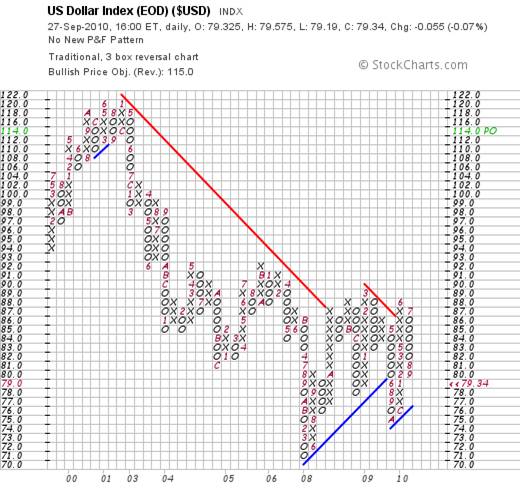
“There is no ‘clear’ reason why the gold price has been rising. If gold has been rising because of a move away from the United States Dollar then we would expect to see a collapse of the US Dollar. The chart below does NOT show signs that the market is expecting a coming collapse in the United States Dollar. In particular, note the fact that the ‘bottom’ at 75 was higher than the ‘bottom’ at 71.’ In particular, note the rising blue trendline – technically speaking, the dollar is in a BULL trend.
“But” you respond “Bernanke recently announced that he was going to flood the markets with more dollars. The dollar must collapse.”
“Don’t listen to what comes out his mouth”, this analyst responds. “Watch what the market is actually doing. For example, have a look at the chart below of the 30 year bond yield.”
The weekly chart below (courtesy stockcharts.com) shows how the exhaustion gap (green circle on the right) was closed four weeks ago.
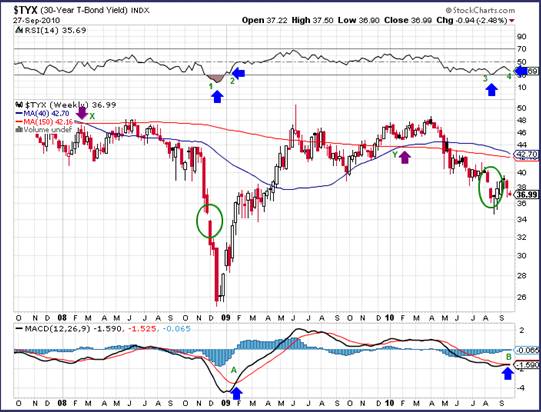
Several other technical issues seem relevant here:
- Note the positions of the 50 week MA relative to the 200 week MA (at X and Y). When it broke down at point X it kept going and the distance between the blue line and the red line grew as the yield collapsed. This time around, the yield fell more sedately and the distance between the blue line (now above the red line) and the red line is not growing. But will the yield collapse again?
- Note the crossover of the MACD buy signals at points A and B. From this it seems likely that the yields will not fall from here.
- Finally, note the arrows at points 1&2 and points 3&4 on the RSI. The RSI is in oversold territory and seems more likely to bounce up from here than to bounce down.
From another perspective (the Point and Figure chart below) the most recent signal has been a “buy” signal (low pole reversal) in context of a prevailing bear trend.
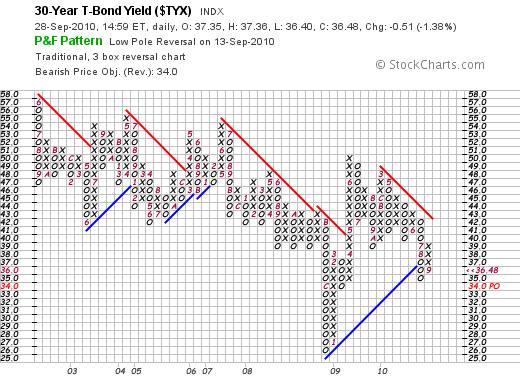
Interim Conclusion #3
Arguably, treasury yields are the most sensitive barometer of investor perceptions. The chart above shows that there is a low probability of yields falling further from these levels. However, the probabilities favour a trading range as opposed to a sharp rise in the foreseeable future.
Question: So, if neither the Industrial Index Chart nor the Yield Chart is giving trend reversal signals – and if the US Dollar is still, technically, in a BULL trend, then why is the gold price rising?
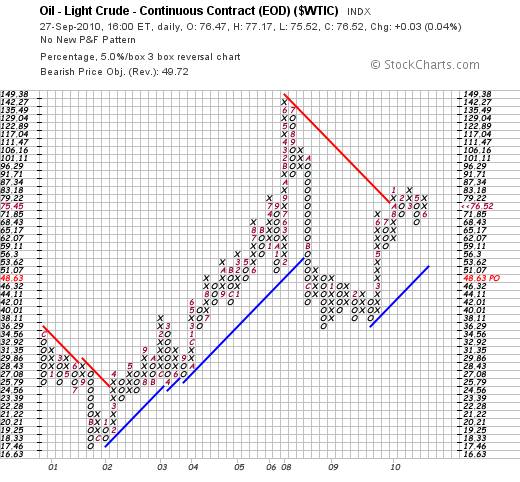
The answer may lie in the energy markets.
The chart below (courtesy stockcharts.com) is of the oil price. It shows that the price of oil has entered a trading range
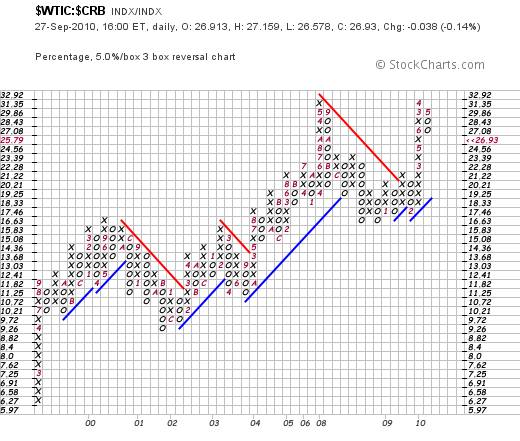
That the oil price seems unlikely to break “up” from this trading range flows from the relative strength chart below – which shows the ratio of the Oil Price to the Commodities Index. This chart is showing a bearish Double Top formation – i.e The oil price looks unlikely to break up relative to other commodities – in particular, with respect to other dollar denominated commodities.
Finally, the chart below is a weekly bar chart of the oil price which shows, quite clearly, that its 40 week moving average is tracking below its 150 week moving average.
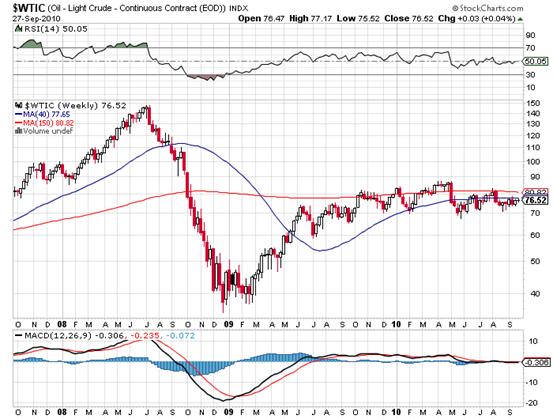
Interim Conclusion #4
The reason that the dollar gold price is rising to new highs cannot be attributed to an impending explosion in inflation because the dollar price of oil is showing no technical signs of wanting to break up either in absolute terms or relative to commodities in general.
Question: Could the reason that the oil price is not giving buy signals be related to the fact that oil is being replaced by natural gas?
Well, the monthly chart below, courtesy http://futures.tradingcharts.com/chart/NG/M is showing (with the exception of one month) generally falling prices on generally rising volumes. There has been selling pressure emerging in the natural gas markets.
TFC Commodity Charts
Natural Gas (NG, NYMEX)
Monthly Price Chart
![]() So the answer to this question must be that the natural gas markets are not showing signs of a build up in demand so much as a build up of hedging activity. Fundamentally, there is a large volume of natural gas that seems likely to find its way onto the world markets in the next few years and the above chart is probably reflecting financial hedging of the producers.
So the answer to this question must be that the natural gas markets are not showing signs of a build up in demand so much as a build up of hedging activity. Fundamentally, there is a large volume of natural gas that seems likely to find its way onto the world markets in the next few years and the above chart is probably reflecting financial hedging of the producers.
Interim Conclusion #5
The reason that the gold price is rising to new heights cannot be attributed to any of the following:
- Impending collapse of the US dollar
- Impending explosion in oil prices
- Impending explosion in natural gas prices.
- Impending outbreak of inflation in general (which would lead to exploding interest rates)
- Impending market “collapse”
So, then why is the gold price rising to new heights?
Answer: For 5,000 years, gold has been the most desirable “asset” which human beings have aspired to own. The rising gold price is reflecting a dawning understanding of the fact that the “game” has changed; and – because there are no signs of panic in the various markets – the most logical driver of a rising gold price is that investors are feeling more optimistic than pessimistic about the future of humanity. Arguably, we are about to find out “why” gold has – from time immemorial – been the most desirable asset.
Summary
It is an unarguable fact that the world economy has become moribund against a background of overpopulation and environmental degradation.
That the gold price is rising in the face of such a fact – and against a background where markets are not showing signs of impending panic – is highly significant.
Overall Conclusion
The rising gold price is pointing a paradigm shift in thinking. To ensure the survival of the human race, human ingenuity is about to make a quantum leap forward. The time frame for this leap forward lies within the “foreseeable” future.
By Brian Bloom
Once in a while a book comes along that ‘nails’ the issues of our times. Brian Bloom has demonstrated an uncanny ability to predict world events, sometimes even before they are on the media radar. First he predicted the world financial crisis and its timing, then the increasing controversies regarding the causes of climate change. Next will be a dawning understanding that humanity must embrace radically new thought paradigms with regard to energy, or face extinction.
Via the medium of its lighthearted and entertaining storyline, Beyond Neanderthal highlights the common links between Christianity, Judaism, Islam, Hinduism and Taoism and draws attention to an alternative energy source known to the Ancients. How was this common knowledge lost? Have ego and testosterone befuddled our thought processes? The Muslim population is now approaching 1.6 billion across the planet. The clash of civilizations between Judeo-Christians and Muslims is heightening. Is there a peaceful way to diffuse this situation or will ego and testosterone get in the way of that too? Beyond Neanderthal makes the case for a possible way forward on both the energy and the clash of civilizations fronts.
Copies of Beyond Neanderthal may be ordered via www.beyondneanderthal.com or from Amazon
Copyright © 2010 Brian Bloom - All Rights Reserved
Disclaimer: The above is a matter of opinion provided for general information purposes only and is not intended as investment advice. Information and analysis above are derived from sources and utilising methods believed to be reliable, but we cannot accept responsibility for any losses you may incur as a result of this analysis. Individuals should consult with their personal financial advisors.
Brian Bloom Archive |
© 2005-2022 http://www.MarketOracle.co.uk - The Market Oracle is a FREE Daily Financial Markets Analysis & Forecasting online publication.