


How High Can Gold Go During the Current Upleg?
Commodities / Gold and Silver 2010 Sep 17, 2010 - 04:18 AM GMTBy: Jason_Hamlin

 Gold fever is converting an increasing number of mainstream investors into gold bugs. Newbies who were fortunate enough to buy gold at any point during this year are no doubt celebrating their gains. And many are looking to take profits now that gold has made another record (nominal) high at $1,279. After all, the gold price has enjoyed an advance of nearly $100 during the past month and we are probably facing some profit taking and correction, right?
Not exactly. The first thing to consider is that while gold has just made a new record nominal high, the price is still nowhere near the inflation-adjusted high of $2,500 to $5,000, depending on whether you use true or manufactured (government) inflation statistics. Secondly, the $100 advance in the past month represents a gain of only 8%, versus the last major upleg which lasted 3 months and registered a gain of more than 26%.
But stocks don’t go up (or down) in a straight line, right?
Not exactly. While they don’t move up in a straight line forever, major uplegs of bull markets have no problem moving nearly straight up for months at a time before correcting or consolidating. If you have been riding the gold bull for a while, you will remember several periods over the past decade where the price seemed to defy gravity.
Are we there again? Can gold possibly continue higher and if so, how high can gold go during the current upleg? Let’s take a look at the gold chart for some insight.
The first thing to notice in the chart below is where the gold price is relative to its 2-year trend channel. Despite claims that gold is overbought and needs to correct, the gold price is only at the midway mark of its trend channel. While this dotted line can and has offered resistance in the past, the larger legs of the bull market blow right through the mid-way line and end up finding resistance around the top line of the trend channel.
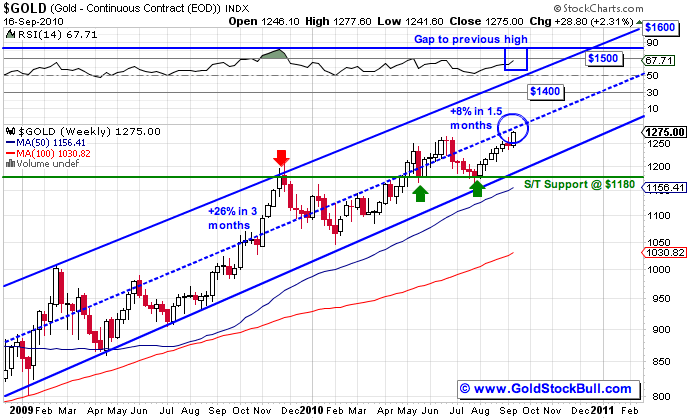
If we get a move similar to the high season last year (Sept – Dec), then the gold price has much higher to go. While $1,350 looks absolutely certain within the next few months, a repeat of last year’s 26% seasonal gain would put gold just shy of $1,500, which is also the top line of its trend channel. And so you don’t think last year’s advance was an anomaly, the average gain of the ten major uplegs in the gold market over the past ten years has been around 25%.
The fundamental landscape has also improved for precious metals in the past year, with significant increases to the M2 money supply, deficit and overall debt. Yes, credit contraction is having some deflationary effects, but the printing presses are about to kick into high gear with QE 2.0. The Fed always has a bias away from deflation and overconfidence in their ability to control inflation. So, I believe we are most likely to see the latter or some type of stagflationary scenario. Money/stimulus will be pumped into the economy in greater and greater quantity just to keep the market afloat. While this avoids bank runs, panic and political protests, it will have the effect of slowly siphoning the wealth from the taxpayer via devaluing the dollar.
Gold demand also soared by 36% during the second quarter. We are now heading into the Indian wedding season, Asian governments are quietly increasing reserves and physical buying is driving up the gold price across all currencies. There are also rumors that JPMorgan, Goldman Sachs and other investment banks are closing their commodity prop trading desks, which would force a covering of massive paper short positions.
So, while some sideways trading and consolidation is possible in the short-term, the current upleg is likely to break through resistance, climb to $1,350 in the short term and push towards the top of the trend channel near $1,500 by the end of the year. If you haven’t established a position in both physical metal and stocks in quality mining companies, what are you waiting for?
By Jason HamlinGold Stock Bull Premium Membership - If you would like to receive my monthly contrarian newsletter, view the Gold Stock Bull portfolio and receive email alerts whenever I am buying or selling, become a premium member today. You can try it out monthly at just $35 and cancel at anytime if you aren’t 100% satisfied. View the video introduction for more details or click here to get started now!
All ideas, opinions, and/or forecasts, expressed or implied herein, are for informational purposes only and should not be construed as a recommendation to invest, trade, and/or speculate in the markets. Any investments, trades, and/or speculations made in light of the ideas, opinions, and/or forecasts, expressed or implied herein, are committed at your own risk, financial or otherwise. The information on this site has been prepared without regard to any particular investor’s investment objectives, financial situation, and needs. Accordingly, investors should not act on any information on this site without obtaining specific advice from their financial advisor. Past performance is no guarantee of future results.
© 2005-2022 http://www.MarketOracle.co.uk - The Market Oracle is a FREE Daily Financial Markets Analysis & Forecasting online publication.