Silver Elliott Wave analysis & forecast
Commodities / Forecasts & Technical Analysis Jan 17, 2007 - 10:06 PM GMTBy: Robert_Watson
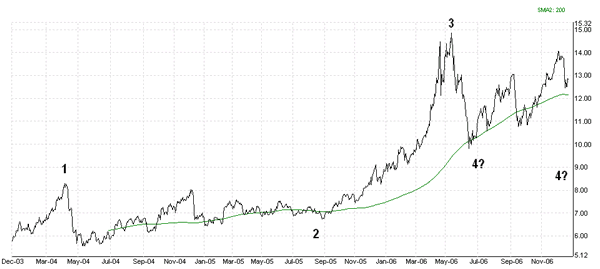
 The silver market continues to move in a state of flux as the metal struggles to free itself from its current period of price correction. However, one must not take this to be a sign of overall weakness in the silver bull market but rather a normal adjustment to the recent $15 highs that caused silver to race too far ahead of its normative indicators. In terms of Elliott Wave analysis, the most probable picture to me is laid out below.

As I see it, we are in or near the final wave 5 blow off phase. When that phase ends depends on when the US Dollar bear finally bottoms out, but I do not expect it to exceed 2008 by much. Waves 1 and 3 have completed with each move seeing silver double in price. How much will silver advance in this final leg up before it takes an extended breather? That is still under debate, but more than double from where wave 5 launches I suspect! From the point of view of this silver-dollar inverse correlation, we should not expect silver to reach its all time high of $50. However, that high will be taken out in subsequent years as Peak Oil begins to tighten its grip.
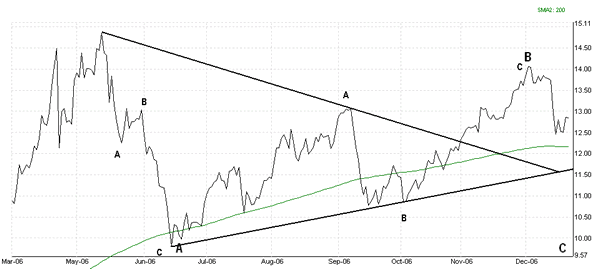
The current Elliott question is whether the wave 4 correction has completed as indicated by our two "4?" annotations? A closer look at the last 7 months below suggests the correction is not over. But we are talking probabilities and not certainties here. The drop from mid May to mid June is a complete 3-wave correction, which in theory could suggest wave 4 was completed quickly but viciously in 4 weeks. That may or may not be true but the extended correction time for the previous wave 2 suggest otherwise.

Another important point is the fact that it WAS a corrective wave and not an impulse wave that began this 7-month downtrend. That is important because the probabilities would demand that if the silver bull were really over then a 5-wave impulse would have heralded the end of the silver bull market. It has not; therefore we believe this is a bull market correction and not the beginning of a silver bear market.
That still leaves the open question of where we may be in the silver scheme of things. The chart suggests a flat ABC wave with a further C move down to near where wave A settled. In fact, the odds suggest a bit lower. We could also posit a double zigzag wave (WXY) but I don't think the final outcome is any much different.
What would negate the idea of the correction being ongoing and confirm the final wave 5 has rather begun? A move above where the B wave completed about $14.00 on our chart I would say. However, a drop below the minor B wave of early October at $10.70 is a confirmation of the C wave in my opinion.
On a more basic level of technical analysis, you will note the symmetric triangle that was breached to the upside in early November. However, this is a somewhat weak triangle since each line is only composed of two points and, as we know any line can be drawn between two random points. The lower line is the more interesting as a breach below it extension to $11.60 at this point in time would be further confirmation of a more extended downside.
How far the final wave 5 may extend will depend from which point it starts its move. From that point on we expect the move to be at least as large as wave 3 but anticipate more if the US dollar makes a successful and sustained breach of the 80 level as measured by the US Dollar Index.
By Robert Watson
Subscribers will be informed on a weekly basis as to the current status of the silver market. Further monthly analysis and comment on the silver market can be read in the subscriber-only Silver Analyst newsletter described at http://silveranalyst.blogspot.com where readers can obtain the first issue free. Comments and questions are also invited via email to silveranalysis@yahoo.co.uk
© 2005-2022 http://www.MarketOracle.co.uk - The Market Oracle is a FREE Daily Financial Markets Analysis & Forecasting online publication.


