


U.S. Unemployment Rises to 9.6%, A Look Beneath the Surface
Economics / US Economy Sep 03, 2010 - 12:49 PM GMTBy: Mike_Shedlock

 This morning the BLS reported a decrease of 64,000 jobs. However, that reflects a decrease of 114,000 temporary census workers.
Excluding the census effect, government lost 7,000 jobs. Were the trend to continue, this would be a good thing because Firing Public Union Workers Creates Real Jobs.
Unfortunately, politicians and Keynesian clown economists will not see it that way. Indeed there is a $26 billion bill giving money to the states to keep bureaucrats employed. This is unfortunate because we need to shed government jobs.
Birth-Death Model
Hidden beneath the surface the BLS Black Box - Birth Death Model added 115,000 jobs, a number likely to be revised lower in coming years. Please note you cannot directly subtract the number from the total because of the way the BLS computes its overall number.
Participation Rate Effects
The civilian labor force participation rate (64.7 percent) and the employment-population ratio (58.5 percent) were essentially unchanged from last month's report. However, these measures have declined by 0.5 percentage points and 0.3 points, respectively, since April.
The drop in participation rate this year is the only reason the unemployment rate is not over 10%. The drop in participation rates is not that surprising because some of the long-term unemployed stopped looking jobs, or opted for retirement.
Nonetheless, I still do not think the top in the unemployment rate is in and expect it may rise substantially later this year as the recovery heads into a coma and states are forced to cut back workers unless Congress does substantially more to support states.
Employment and Recessions
Calculated Risk has a great chart showing the effects of census hiring as well as the extremely weak hiring in this recovery.
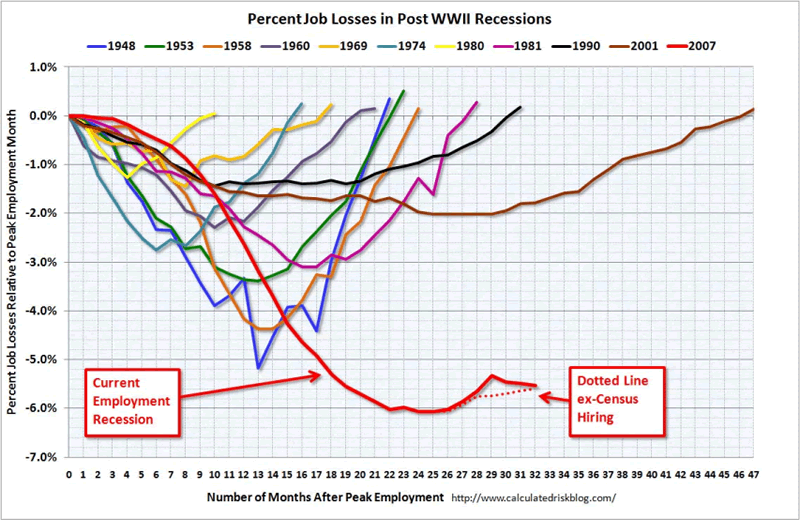
The dotted lines tell the real story about how pathetic a jobs recovery this has been. Bear in mind it has taken $trillions in stimulus to produce this.
June, July Revisions
The change in total nonfarm payroll employment for June was revised from -221,000 to -175,000, and the change for July was revised from -131,000 to -54,000.
Those revisions look good but it is important to note where the revisions comes from. The loss of government jobs in June was revised from -252,000 to -236,000 and July from -202 to -161,000.
Major Discrepancies
The BLS jobs report for August does not match ADP payroll estimates. Moreover, neither the BLS jobs report nor the ADP jobs report is consistent with the hot ISM number reported Wednesday. Both the BLS (details below) and ADP have a decline in manufacturing employment while ISM had a rise.
Please see Rosenberg says "ISM Flunks Sniff Test "; Cashin calls ISM "an Outlier"; ADP, Other Data Does Not Confirm for more details that suggest the ISM number is nonsense.
Part-Time Employment
The number of involuntary part-time workers increased by 331,000 over the month to 8.9 million. In January, the number of employees working "part-time for economic reasons" was 8.6 million.
Now for this month's report ....
July 2010 Report
Please consider the Bureau of Labor Statistics (BLS) July 2010 Employment Report.
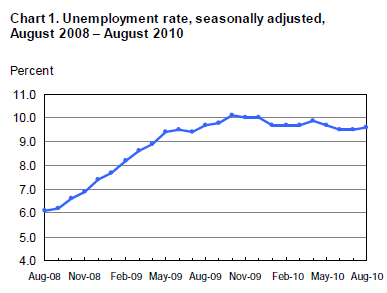
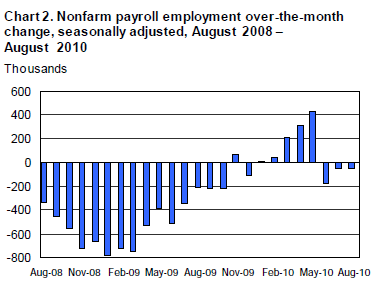
Nonfarm payroll employment changed little (-54,000) in August, and the unemployment rate was about unchanged at 9.6 percent, the U.S. Bureau of Labor Statistics reported today. Government employment fell, as 114,000 temporary workers hired for the decennial census completed their work. Private-sector payroll employment continued to trend up modestly (+67,000).
Unemployment Rate - Seasonally Adjusted
Nonfarm Payroll Employment - Seasonally Adjusted
Since September 2009, temporary help services employment has risen by 362,000.
Establishment Data
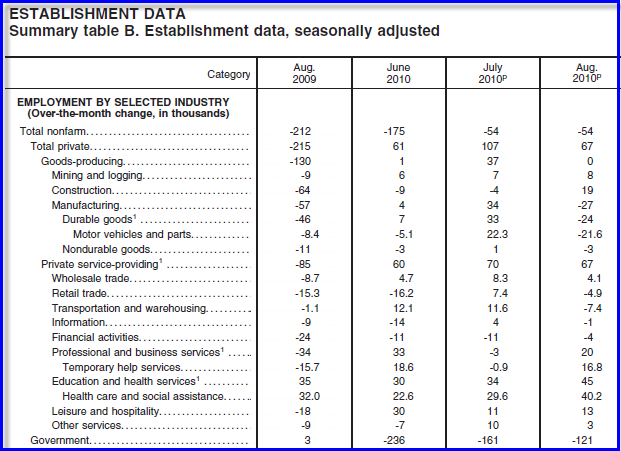
Highlights
- 54,000 jobs were lost
- 19,000 construction jobs were added
- 27,000 manufacturing jobs were lost
- 38,000 service providing jobs were added
- 67,00 retail trade jobs were added
- 20,000 professional and business services jobs were added
- 45,000 education and health services jobs were added
- 13,000 leisure and hospitality jobs were added
- 121,000 government jobs were lost. Of them, 143,000 were temporary census workers
Note: some of the above categories overlap as shown in the preceding chart, so do not attempt to total them up.
Index of Aggregate Weekly Hours
Production and non-supervisory work hours rose .1 to 33.5 hours (from a revised lower hours total of 33.4 hours). Average hourly earnings rose $.03 at $19.08.
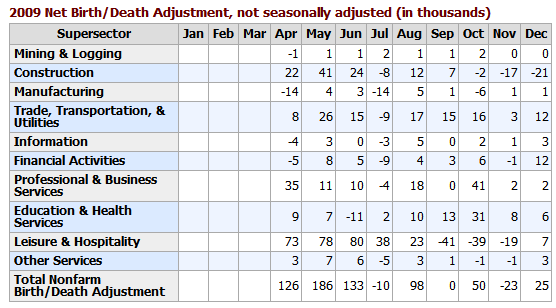
Birth Death Model Revisions 2009
Birth Death Model Revisions 2010
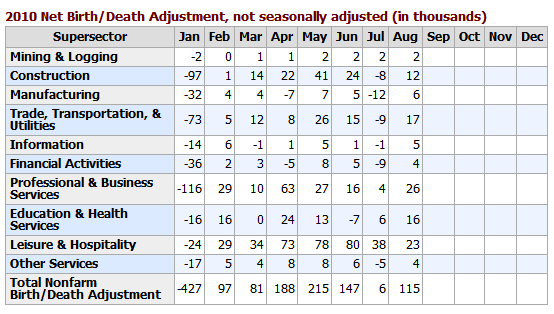
Birth/Death Model Revisions
The BLS Birth/Death Model methodology is so screwed up and there have been so many revisions and up it is pointless to further comment other than to repeat a few general statements.
Please note that one cannot subtract or add birth death revisions to the reported totals and get a meaningful answer. One set of numbers is seasonally adjusted the other is not. In the black box the BLS combines the two coming out with a total. The Birth Death numbers influence the overall totals but the math is not as simple as it appears and the effect is nowhere near as big as it might logically appear at first glance.
BLS Black Box
For those unfamiliar with the birth/death model, monthly jobs adjustments are made by the BLS based on economic assumptions about the birth and death of businesses (not individuals).
Birth/Death assumptions are supposedly made according to estimates of where the BLS thinks we are in the economic cycle. Theory is one thing. Practice is clearly another.
Household Data
The number of unemployed persons (14.9 million) and the unemployment rate (9.6 percent) were little changed in August. From May through August, the jobless rate remained in the range of 9.5 to 9.7 percent.
The number of long-term unemployed (those jobless for 27 weeks and over) declined by 323,000 over the month to 6.2 million. In August, 42.0 percent of unemployed persons had been jobless for 27 weeks or more.
In August, the civilian labor force participation rate (64.7 percent) and the employment-population ratio (58.5 percent) were essentially unchanged.
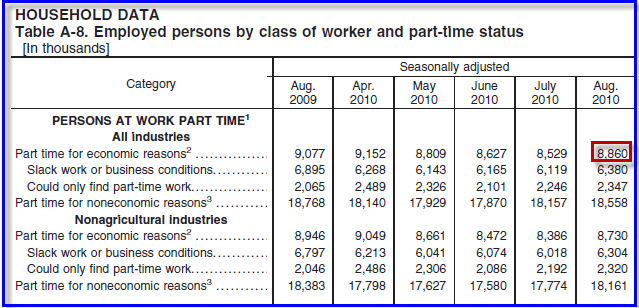
The number of persons employed part time for economic reasons (sometimes referred to as involuntary part-time workers) increased by 331,000 over the month to 8.9 million. These individuals were working part time because their hours had been cut back or because they were unable to find a fulltime job.
[Mish Note: In January the number was 8.3 million]
Persons Not in the Labor Force
About 2.4 million persons were marginally attached to the labor force in August, little changed from a year earlier. (The data are not seasonally adjusted.) These individuals were not in the labor force, wanted and were available for work, and had looked for a job sometime in the prior 12 months. They were not counted as unemployed because they had not searched for work in the 4 weeks preceding the
survey.Table A-8 Part Time Status
The key take-away is there are 8,860,00 workers whose hours may rise before those companies start hiring more workers.
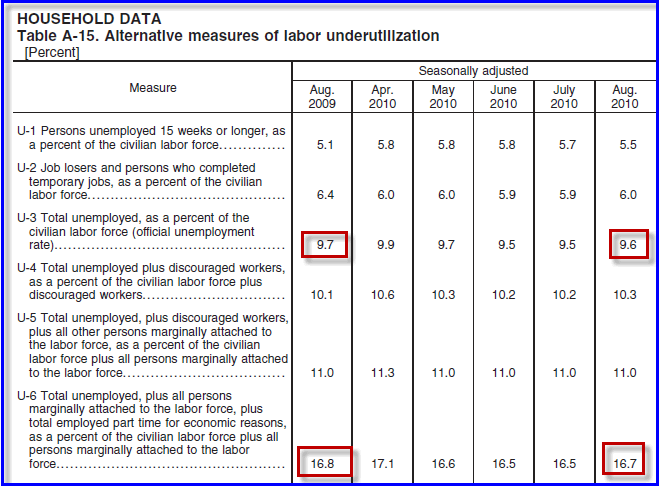
Table A-15
Table A-15 is where one can find a better approximation of what the unemployment rate really is.
Grim Statistics
The official unemployment rate is 9.6%. However, if you start counting all the people that want a job but gave up, all the people with part-time jobs that want a full-time job, all the people who dropped off the unemployment rolls because their unemployment benefits ran out, etc., you get a closer picture of what the unemployment rate is. That number is in the last row labeled U-6.
It reflects how unemployment feels to the average Joe on the street. U-6 is 16.7%, up .2 from last month.
Looking ahead, there is no driver for jobs. Moreover, states are in forced cutback mode on account of shrinking revenues and unfunded pension obligations. Shrinking government jobs and benefits at the state and local level is a much needed adjustment. Those cutbacks will weigh on employment and consumer spending for quite some time.
Expect to see structurally high unemployment for years to come.
Keep in mind that huge cuts in public sector jobs and benefits at the city, county, and state level are on the way. These are badly needed adjustments. However, economists will not see it that way, nor will the politicians.
Recap
The private sector hiring increase of 67,000 is very weak for a recovery. That number is not enough to keep the unemployment rate steady. However, the unemployment rate comes from the Household Survey (a phone survey), not from actual payroll data.
By Mike "Mish" Shedlock
http://globaleconomicanalysis.blogspot.com
Click Here To Scroll Thru My Recent Post ListMike Shedlock / Mish is a registered investment advisor representative for SitkaPacific Capital Management . Sitka Pacific is an asset management firm whose goal is strong performance and low volatility, regardless of market direction.
Visit Sitka Pacific's Account Management Page to learn more about wealth management and capital preservation strategies of Sitka Pacific.
I do weekly podcasts every Thursday on HoweStreet and a brief 7 minute segment on Saturday on CKNW AM 980 in Vancouver.
When not writing about stocks or the economy I spends a great deal of time on photography and in the garden. I have over 80 magazine and book cover credits. Some of my Wisconsin and gardening images can be seen at MichaelShedlock.com .
© 2010 Mike Shedlock, All Rights Reserved.
© 2005-2022 http://www.MarketOracle.co.uk - The Market Oracle is a FREE Daily Financial Markets Analysis & Forecasting online publication.