The Upcoming Stock Market 4-year Cycle Bottom
Stock-Markets / Cycles Analysis Aug 26, 2010 - 06:00 PM GMTBy: Clif_Droke

 Many observers have been wondering if the upcoming 4-year cycle bottom in a few weeks will exert a negative impact on stock prices when the previous 4-year cycle bottom in 2006 barely registered. You may recall that the period from August through December of 2006 saw a stellar performance from the market that left many market technicians perplexed as to why the 4-year cycle bottom left no discernible impact on stock prices at that time. Many of them tried to excuse the lack of downward bias in the broad market in the fall of ’06 by saying that the 4-year cycle would bottom later that year, despite the fact that the 4-year cycle is fixed and always bottoms around the end of the third quarter in late September/early October.
This time around there are some market analysts who insist that downward pressure from the 4-year cycle need not be felt against stocks since the effect of this cycle was negligible in 2006. They also point to the improvement in corporate earnings and currently huge levels of corporate cash as potential barriers against a 4-year cycle correction in September. While the upcoming 4-year cycle bottom need not be a catastrophic event like the 6-year cycle bottom was in 2008, the evidence suggests that the stock market will definitely feel the negative effects of the 4-year cycle bottom as we head into September.
One reason why stocks didn’t decline in the August-September period of 2006 during the previous 4-year cycle bottoming phase was because the Kress 10-year and 12-year cycles were still in the ascending phase. This time around these two cycles are in decline, which means the bigger yearly cycles will be leaning against the market during the vulnerable September period while the 4-year cycle bottoms. Also in the August-September ’06 period the stock market’s quarterly bias was distinctly to the upside. This indicator is an important one to watch when any of the yearly cycles are about to bottom since the quarterly cycle bottoms simultaneously with the yearly cycles in the late September/early October period.
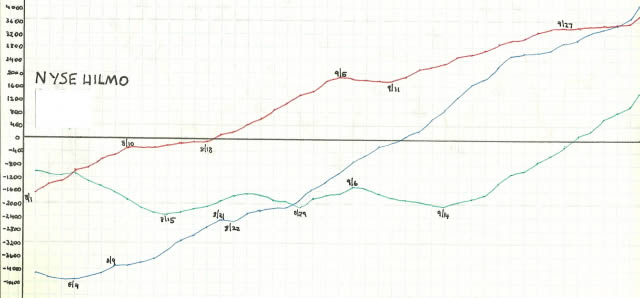
Here is what the NYSE quarterly internal momentum indicator looked like back in the summer of ’06. This particular indicator reflects the interim demand for stocks based on a measurement of the rate of change (momentum) in the net number of stocks making 52-week highs versus lows. Four years ago this indicator (red line in the following chart) was screaming to the upside on a daily basis, which was arguably the strongest period this market reflected at any time in the last four years.

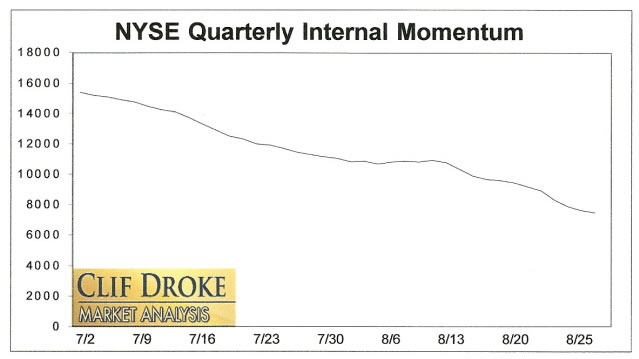
Today the quarterly momentum bias indicator is the opposite of what it was in 2006. As you can see, the market’s quarterly bias is distinctly to the downside. If this indicator continues its decline heading into September, there will be strong reason to suspect the stock market will become vulnerable to selling pressure as the 4-year cycle bottom approaches.

Compounding the problem for stocks heading into the 4-year cycle bottom is the financial media’s fixation on the currently negative employment and economic situation. To take just one instance of the recurring theme the media have been emphasizing in the last several days, the Associated Press wrote the following headline today: “Bad news on homes, goods adds to air of recession.” We’ve also been hearing more and more mention of the term “double dip recession” and this repetition is starting to exert a negative impact on the minds of many market participants. As we talked about in a recent report, whenever market internals are particularly weak and a major cycle is in the final “hard down” phase, negative news and bearish investor sentiment tend to become self-fulfilling and can actually add to the market’s downward tendency as the cycle bottoms. We witnessed this during the credit crash of 2008 and it’s being replayed (albeit on a less emphatic scale) right now.
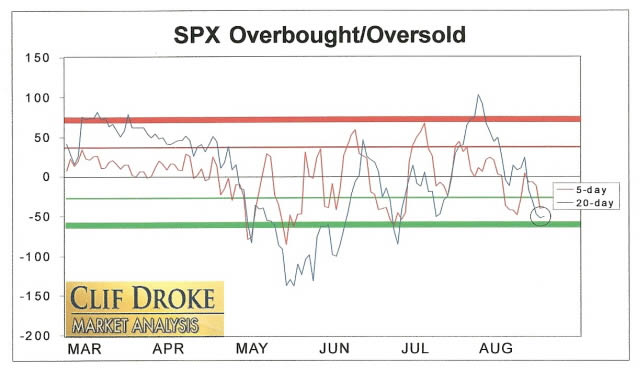
The 5-day and 20-day price oscillators for the SPX are currently reflecting an oversold condition for the S&P, which means short covering could be in evidence in upcoming days. Unless the internal momentum indicators show some drastic improvement between now and early September, however, the stock market will have its work cut out as we head closer to the 4-year cycle bottom.

Gold
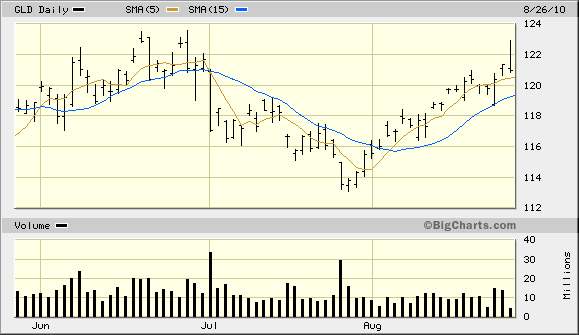
Our core position right now is in the SPDR Gold Trust ETF (GLD), which to date has benefited from the increased level of fear and uncertainty among investors over the state of the economy. Traders rushed back into gold last week after shunning it earlier this summer. Gold stocks appear to be getting a lift from the rally in the gold price itself as money flowing out of the broad market is finding its way into the relative strength/momentum shares of mining companies that we’ve been highlighting recently. We continue to use the dominant immediate-term trend line shown below as our trading guide for GLD. Fear is gold’s best friend and as long as it abounds gold will continue to benefit from it.

Short Selling
One of the demands among traders in recent years has been the desire to capture moves in individual stocks and ETFs in tough market environments. Most stock market literature specializes in trading techniques geared toward bull markets. Comparatively few books have been devoted to explaining techniques for profiting in down markets. Many traders are intimidated by the prospect of short selling and, quite rightly, view it as a risky proposition.
Short selling is risky if you lack a good technical discipline for selecting short sale candidates among individual stocks and executing the trade properly. With the right method, the risks in shorting can be minimized and the results profitable. Although the Wall Street press doesn’t like to publicize it, timely short selling can create profits for small traders much faster than conventional “buy and hold” investing. In the years leading up to the fateful 120-year Kress Cycle bottom in 2014, profitable opportunities for selling short will only increase.
It’s for the purpose of presenting a clear explanation and disciplined technical method for selling short that I wrote, “How to Sell Short in the Stock Market.” Based on years of experience, this book takes you on a tour of the trading conditions that merit a short selling approach and explains how to grasp the opportunities as they arrive. In this 130-page volume you’ll also discover how moving averages can be used to set up short sales to good effect. Dozes of chart patterns from actual short trades are provided by way of illustration to show the appropriate way to set up a short trade. Click here to order:
http://www.clifdroke.com/books/book10.mgi
Order your copy today and receive as an added bonus a copy of my latest booklet which discusses the best long-term moving averages to use with stock trading.
By Clif Droke
www.clifdroke.com
Clif Droke is the editor of the daily Gold & Silver Stock Report. Published daily since 2002, the report provides forecasts and analysis of the leading gold, silver, uranium and energy stocks from a short-term technical standpoint. He is also the author of numerous books, including 'How to Read Chart Patterns for Greater Profits.' For more information visit www.clifdroke.com
Clif Droke Archive |
© 2005-2022 http://www.MarketOracle.co.uk - The Market Oracle is a FREE Daily Financial Markets Analysis & Forecasting online publication.


