


Slicing the Neckline Head and Shoulders Stock Index Pattern with the Elliott Wave Count
Stock-Markets / Stock Markets 2010 Aug 17, 2010 - 03:09 PM GMTBy: EWI

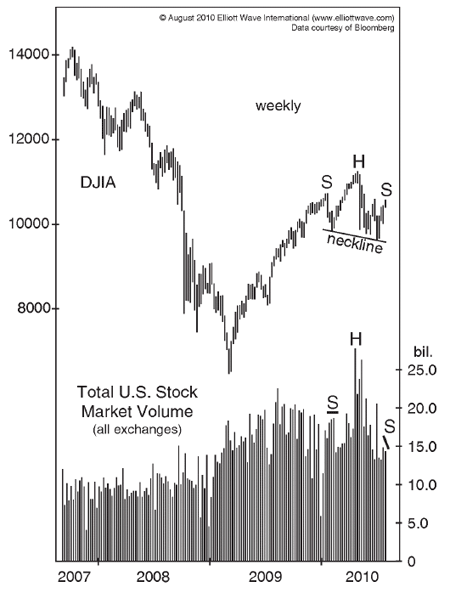
 In the August issue of his Elliott Wave Theorist, market forecaster Robert Prechter alerted readers that the U.S. stock market was slicing the neckline of a classic head-and-shoulders pattern in technical analysis, and that this may send the market into critical condition.
Prechter said that when the Elliott wave count and a head-and-shoulders pattern are saying the same thing about the stock market, it's best to pay attention.
Here's how the August issue of the Elliott Wave Financial Forecast, the sister publication to Prechter's Theorist, described the head and shoulders pattern unfolding in the stock market:
"The weekly Dow chart [below] shows the development of an intermediate-term, head-and-shoulders pattern from the January high at 10,729.90 to the present. The January high marks the left shoulder, the April 26 high at 11,258 is the head, and the right shoulder is now ending. The April [Theorist] discussed the pertinent characteristics that Edwards and Magee used to define this technical pattern ... all apply to the current formation. Observe how weekly stock trading volume has contracted during the development of the right shoulder, a necessary trait of this pattern. The downward-sloping neckline -- exactly as on the big ten year pattern -- displays market weakness, which is consistent with our interpretation of the wave structure."
This chart shows the head-and-shoulders pattern.
Here's what Robert Prechter himself said in a recent Elliott Wave Theorist:
"Generally, when the neckline slopes downward, the right shoulder does not rise to the level of the left shoulder ..."
Please look at the chart again -- then re-read Prechter's quote.
This article was syndicated by Elliott Wave International and was originally published under the headline Slicing the Neckline: When the Market May Go into "Critical Condition". EWI is the world's largest market forecasting firm. Its staff of full-time analysts lead by Chartered Market Technician Robert Prechter provides 24-hour-a-day market analysis to institutional and private investors around the world.
About the Publisher, Elliott Wave International
Founded in 1979 by Robert R. Prechter Jr., Elliott Wave International (EWI) is the world's largest market forecasting firm. Its staff of full-time analysts provides 24-hour-a-day market analysis to institutional and private around the world.
© 2005-2022 http://www.MarketOracle.co.uk - The Market Oracle is a FREE Daily Financial Markets Analysis & Forecasting online publication.