


Investors Keep Gold ans Silver Analysis Simple
Commodities / Gold and Silver 2010 Aug 13, 2010 - 03:51 AM GMT

 Metals ‘KISS’ Analysis – (Keep It Simple... Umm… Silly) - It is interesting to note just how complex investment advisors and investors can make their market analysis. When it comes to analyzing the markets we do enjoy “chewing” on a lot of data, but often good old fashioned simplicity and common sense are the most effective strategy.
We don’t believe in an indefinite ‘buy and hold’ strategy nor do we concern ourselves with daily short term movements. We are interested in two main objectives:
- Catching Macro Bull Market moves such as the 1970’s commodities bull, the stocks bull move from 1980 to 2000 and also the current 2000’s commodities bull.
- We also strive to identify “intermediate term trends” in order to help us determine when to add to new positions or lighten up on existing holdings within the bull market.
When we look back at the Silver bull market, since 2001 we can see very distinct periods of price consolidation followed by trending advances.
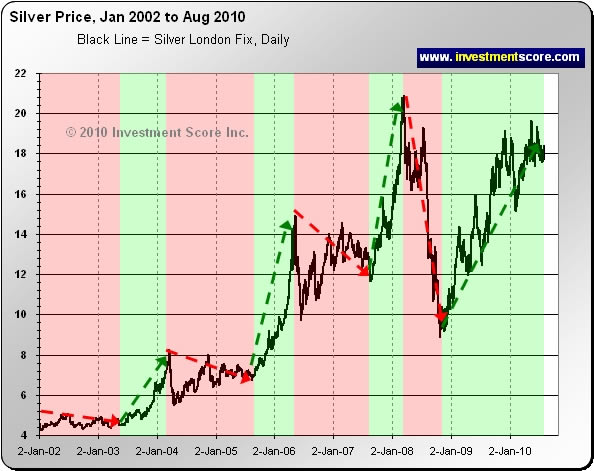
The red portion of the above chart highlights the periods of consolidation in the price of silver and the green highlights the trending advances. When viewing this chart we notice a few things:
- A fairly significant correction followed the first three green advances.
- It would likely be beneficial to avoid adding to positions near the end of a green advance. It also may be beneficial to lighten up on positions at the end of a green advance.
- It would likely be beneficial to add to positions near the end of a red consolidation period. It may not be beneficial to exit positions at the end of a red consolidation period.
- From the end of the consolidation period the first three advances were short in duration. The current advance has lasted significantly longer.
- From the end of the consolidation period the first three advances from bottom to top were smaller than the current advance.
One may conclude that at this time there is considerable risk in adding to new positions as the current green section has advanced higher and lasted longer in duration than previous moves. This does not mean that prices cannot go higher from these levels but it does suggest that a pullback may be overdue.
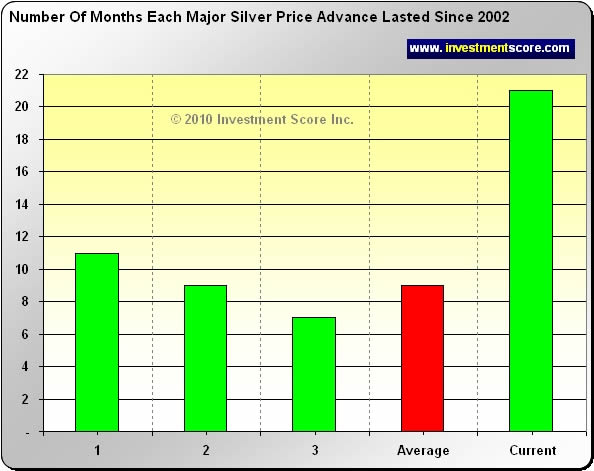
The above chart clearly illustrates how many more months the current advance has lasted relative to the previous three advances during this bull market.
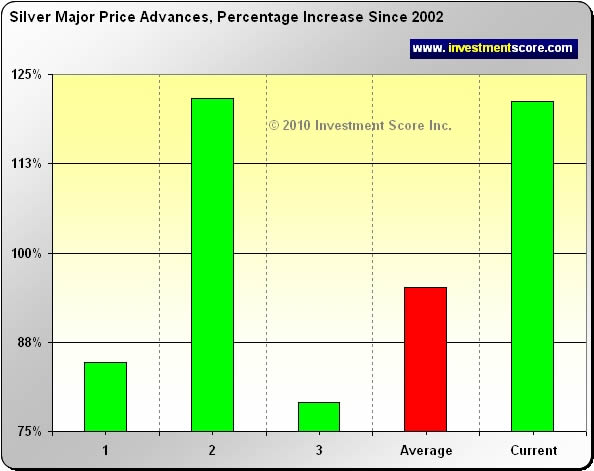
The above chart clearly illustrates how the percentage price increase has climbed higher than the average of the previous three advances.
The above three charts all help clarify that the current advance has lasted longer and climbed higher than the previous three advances. Based on this simple analysis one may decide to exercise caution instead of being aggressively bullish going forward.
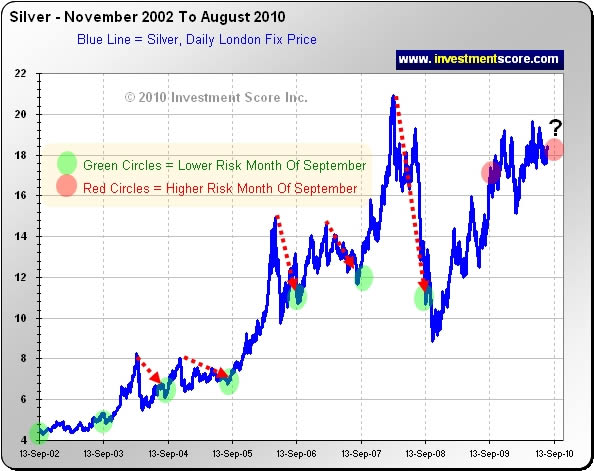
The chart above helps illustrates the seasonal pattern tendencies in the price of silver since 2002. The green circles and red arrows help illustrate the usual drop in the price of silver around the fall months. What we find interesting in this chart is that September 2009 did not follow this usual pattern. Given the regular history of this pattern we tend to be more cautious when we are faced with such unusual and unpredictable price action.
To be clear we are extremely bullish on the price of precious metals in the long term. We are also not predicting that silver or gold must drop in price in the near term. Anything is possible in these markets and near term higher prices would not surprise us. However, in the world of investing we like to keep things in perspective and exercise caution when it is prudent to do so. Unfortunately too many investors will chase performance and continually buy when a market is up and sell when it is down.
To learn more about our service and to sign up for our free newsletter please visit us at www.investmentscore.com.
By Michael Kilback
Investmentscore.com
Investmentscore.com is the home of the Investment Scoring & Timing Newsletter. Through our custom built, Scoring and Timing Charts , we offer a one of a kind perspective on the markets.
Our newsletter service was founded on revolutionary insight yet simple principles. Our contrarian views help us remain focused on locating undervalued assets based on major macro market moves. Instead of comparing a single market to a continuously moving currency, we directly compare multiple major markets to one another. We expect this direct market to market comparison will help us locate the beginning and end of major bull markets and thereby capitalize on the largest, most profitable trades. We pride ourselves on cutting through the "noise" of popular opinion, media hype, investing myths, standard over used analysis tools and other distractions and try to offer a unique, clear perspective for investing.
Disclaimer: No content provided as part of the Investment Score Inc. information constitutes a recommendation that any particular security, portfolio of securities, transaction or investment strategy is suitable for any specific person. None of the information providers, including the staff of Investment Score Inc. or their affiliates will advise you personally concerning the nature, potential, value or suitability or any particular security, portfolio of securities, transaction, investment strategy or other matter. Investment Score Inc. its officers, directors, employees, affiliates, suppliers, advertisers and agents may or may not own precious metals investments at any given time. To the extent any of the content published as part of the Investment Score Inc. information may be deemed to be investment advice, such information is impersonal and not tailored to the investment needs of any specific person. Investment Score Inc. does not claim any of the information provided is complete, absolute and/or exact. Investment Score Inc. its officers, directors, employees, affiliates, suppliers, advertisers and agents are not qualified investment advisers. It is recommended investors conduct their own due diligence on any investment including seeking professional advice from a certified investment adviser before entering into any transaction. The performance data is supplied by sources believed to be reliable, that the calculations herein are made using such data, and that such calculations are not guaranteed by these sources, the information providers, or any other person or entity, and may not be complete. From time to time, reference may be made in our information materials to prior articles and opinions we have provided. These references may be selective, may reference only a portion of an article or recommendation, and are likely not to be current. As markets change continuously, previously provided information and data may not be current and should not be relied upon.
Investmentscore.com Archive |
© 2005-2022 http://www.MarketOracle.co.uk - The Market Oracle is a FREE Daily Financial Markets Analysis & Forecasting online publication.