Is Gold Crash Proof This Time Around?
Commodities / Gold and Silver 2010 Aug 10, 2010 - 12:45 PM GMTBy: Graham_Summers
 I’ve been receiving quite a few emails regarding the topic of Gold and how it will perform if another Crash hits. The following are my thoughts on this matter.
The first thing that needs to be said is that IF we have another systemic meltdown like that of Autumn 2008, Gold will likely go down along with everything else. There are simply too many big players (hedge funds, investment banks, etc) with heavy exposure to Gold who would be forced to liquidate their positions during a systemic collapse.
I know this is not what the Gold bugs want to hear, but during systemic Crises, just about every investment on the planet plunges while the US Dollar and Treasuries rally. Of course, this time around if another 2008-type event hits, it will undoubtedly involve or be focused on sovereign debt. So this raises the potential that Treasuries, particularly those on the long-end of the yield curve, could be hammered as well as all other assets outside the Dollar. This is worth keeping in mind for those who view Treasuries as a safe haven.
So if we go into a 2008-type event, Gold will fall. It will likely fall much less than other assets (stocks and industrial commodities), but it will still go down at least at first. This forecast is confirmed by the market action in 2008 as well as the market collapse from April 2010-July 2010. Both times Gold took a hit, but both times it came back quickly.
So if you’re heavily exposed to Gold, you’re going to need to think “big picture” or have a very strong stomach when the market Crashes.
Now, let’s take a look at the charts.
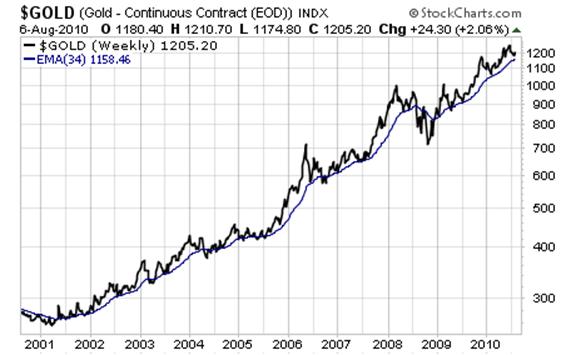
For starters, the number one metric you need to focus on in terms of determining Gold’s market action is the 34-week exponential moving average. Since the Gold bull market began in 2001, this has been THE support line for Gold.

As you can see, Gold has only broken below this line ONCE in the last ten years and that was during the 2008 systemic collapse. So take a note of this line and always watch where Gold trades relative to it.
Indeed, a significant break below this line that DOESN’T occur during a system Crash would be a MAJOR warning that the Gold bull market is in trouble. Remember, the ONLY time we took this line out before was during the systemic collapse in 2008. So a break below it WITHOUT a Crisis would be VERY bearish.
And if Gold breaks below this line on its own (without a Crisis) and then fails to reclaim it… well, then it would be SERIOUS time to reevaluate the Gold bull market story.
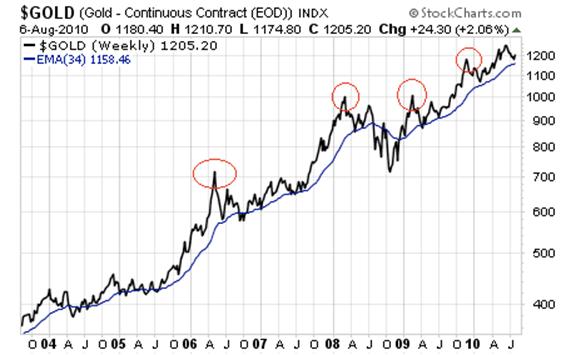
Because of its significance as THE support line for the Gold bull market, the 34-week exponential moving average also serves as an excellent gauge for determining when Gold needs to take a breather or correct.
Indeed, anytime Gold has stretched too far away from this line to the upside, it has usually staged a pretty sharp reversal to re-test this line. I’ve circled the most significant episodes of this from the last seven years in red on the chart below.

These are the BIG picture gauges and items to take note of: the points to remember in terms of determining where Gold is in its bull market and whether it’s an asset class you want to “buy and hold.”
Now let’s move into the more intermediate gauges and items relevant to determining Gold’s action from a trading perspective in the past and today.
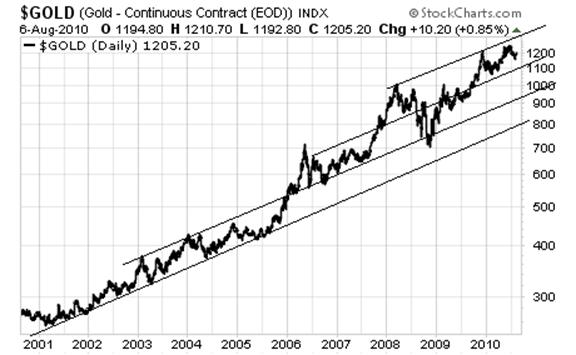
Gold’s bull market of the last ten years has largely taken place within the confines of several very clear upward trading channels. Indeed, each “leg up” has featured Gold breaking above the upper trend-line of a given channel at which point said upper trend-line became the lower trend-line for the next trading channel (see below).

As you can see, the first “leg up” in Gold’s bull market took place from 2001 to late 2005. At that point Gold broke out of its old trading channel and entered its “next leg up” which took place from 2006-until early 2008 when the Bear Stearns crisis blasted Gold into yet another trading range.
The systemic Crash in Autumn 2008 brought Gold back down into a former range (the only time this happened in the last 10 years), but the precious metal bounced back quickly. It DID have some difficulty breaking into its final “leg up” and staying there this time around, but by mid-2009, Gold was again on a tear entering its highest trading range yet where it remains today.
You’ll note that the clear significance of these various trend lines have made for some great trading: virtually every test of a trend line to the upside or downside made for a good exit or entry point for a short-term trade.
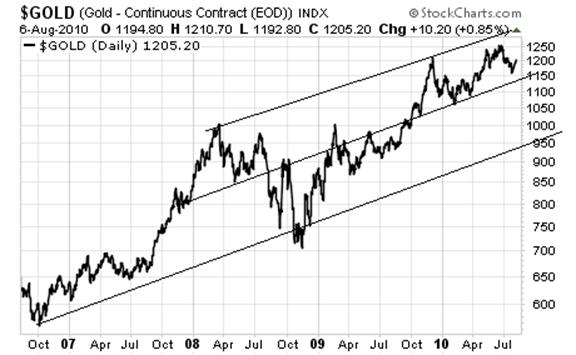
As I write this, Gold is trading in a well-defined range between $1,150 and $1,300. Going by Gold’s action of the last 10 years, we could see the precious metal continue to trade in this range for a while without breaking out either way. This, of course, assumes we don’t have another systemic meltdown AND that the Gold bull market has plenty of more room to run.

The major indicators that could nullify this forecast are:
- A break below the lower trend line WITHOUT a Crash
- A break above the upper trend line that held
Regarding #1, if Gold broke below its lower trend line without a systemic “episode,” it would represent the first time Gold broke to a lower trading range without systemic risk. That would be a MAJOR red flag to watch out for if you’re a Gold bull.
Conversely, a significant break above $1,300 would signal yet another “leg up” has begun and would a MAJOR sign that the Gold bull market has plenty of more room to run.
A final significant move to watch for would be if Gold were to collapse into a lower trading range as a result of a Crash and NOT break out again. Even during the 2008 disaster, Gold was back to re-testing its upper trend line within a few months. So if another systemic Crash hits and Gold doesn’t bounce back quickly that’s ALSO a major warning sign that the Gold bull market is in trouble.
We’ve covered a lot of ground here, so I’ll close this article by listing the main points of this article:
- “buy and hold” Gold investors MUST focus on the 34-week exponential moving average (currently $1,158). A break below this level WITHOUT a Crash is BAD NEWS.
- Traders should focus on Gold’s trend lines for determining entry and exit points. Currently the trend lines are $1,300 on the upside and $1,150 on the downside.
A break below $1,150 WITHOUT a Crash would be a MAJOR warning to the bulls. So would a break below $1,150 WITH a Crash that wasn’t quickly followed by a strong bounce back and re-test of the upper trend line.
Good Investing!
Graham Summers
PS. If you’re worried about the future of the stock market, I highly suggest you download my FREE Special Report detailing SEVERAL investments that could shelter your portfolio from any future collapse. Pick up your FREE copy of The Financial Crisis “Round Two” Survival Kit, today at: http://www.gainspainscapital.com/MARKETING/roundtwo.html
Graham Summers: Graham is Senior Market Strategist at OmniSans Research. He is co-editor of Gain, Pains, and Capital, OmniSans Research’s FREE daily e-letter covering the equity, commodity, currency, and real estate markets.
Graham also writes Private Wealth Advisory, a monthly investment advisory focusing on the most lucrative investment opportunities the financial markets have to offer. Graham understands the big picture from both a macro-economic and capital in/outflow perspective. He translates his understanding into finding trends and undervalued investment opportunities months before the markets catch on: the Private Wealth Advisory portfolio has outperformed the S&P 500 three of the last five years, including a 7% return in 2008 vs. a 37% loss for the S&P 500.
Previously, Graham worked as a Senior Financial Analyst covering global markets for several investment firms in the Mid-Atlantic region. He’s lived and performed research in Europe, Asia, the Middle East, and the United States.
© 2010 Copyright Graham Summers - All Rights Reserved
Disclaimer: The above is a matter of opinion provided for general information purposes only and is not intended as investment advice. Information and analysis above are derived from sources and utilising methods believed to be reliable, but we cannot accept responsibility for any losses you may incur as a result of this analysis. Individuals should consult with their personal financial advisors.
Graham Summers Archive |
© 2005-2022 http://www.MarketOracle.co.uk - The Market Oracle is a FREE Daily Financial Markets Analysis & Forecasting online publication.


