EURIBOR, Euro and USD Index
Currencies / US Dollar Aug 04, 2010 - 07:37 AM GMTBy: Ashraf_Laidi
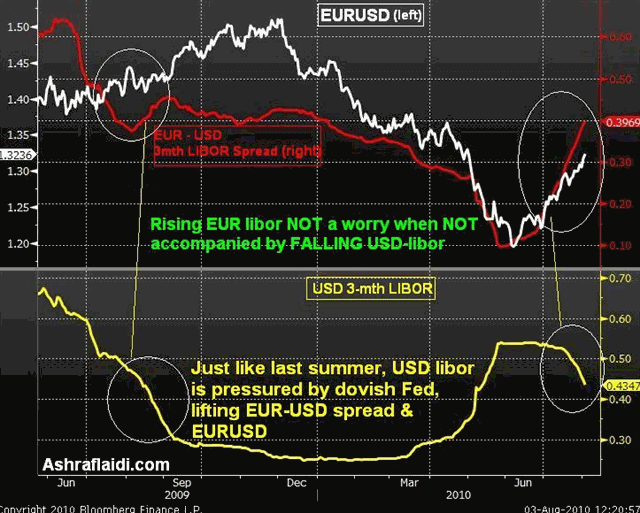
 Many have expressed scepticism with strength of the euro at a time when EURIBOR and EUR-Libor rates remained on the rise. EUR 3-month LIBOR stands at 12-month high of 0.83%, up 46% from its March lows. Yet unlike in April-May when rising Eurozone rates resulted from plummeting inter-bank confidence and falling liquidity in the system, the recent strengthening in Eurzone interbank rates has been partly boosted by improved macroeconomic/bank earnings figures, as well as a stabilizing currency.
Rising EURIBOR and EUR 3-month LIBOR are primarily negative for the euro at times when eroding interbank confidence leads to a shortage of US dollars in the global monetary system, to the extent of boosting USD-denominated LIBOR. But thats not been the case over the past 6 weeks. While EUR 3-month libor has risen by more than 20-bps since the peak of the sovereign crisis in early June, USD 3-month LIBOR fell by nearly 15-bps during the same period. Weak US data, FOMC economic downgrades and broadening Fed dovishness have accelerated the decline in USD-libor. Consequently, the chart below shows the EUR-USD 3-month libor spread (EUR minus USD as indicated by red graph) to have risen to its highest level since January, closely followed by a rising euro.

Just Like in October 2009
The steepness of the EUR-USD libor spread is instrumental in boosting EURUSD, in a manner that is highly similar to Q3-Q4 2009 (left circle) when USD-libor fell below its Japanese counterpart for the first time. That was the time when markets allowed for the possibility of fresh QE in the US. As is the case today, the Federal Reserve was the only major central bank most likely to add on to its existing asset purchases, while the BoE had ended its QE program and the ECB standing pat. The result was a broad decline in the US dollar, coupled with rising equities and soaring energy and metal prices.
A 200-day MA unlike any other
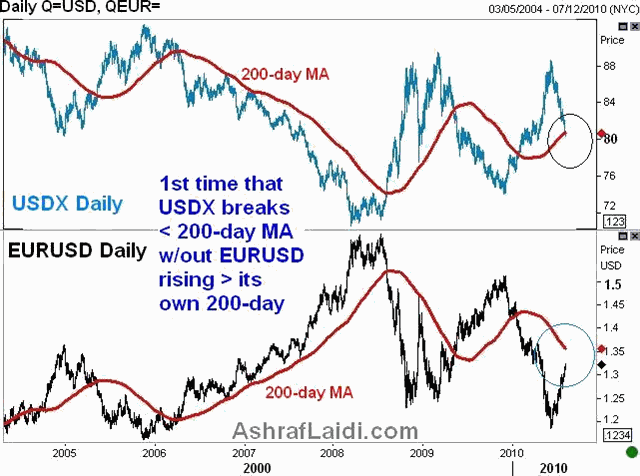
The US dollars decline made the headline today when the USD index hit 80.59, falling below its 200-day moving average for the first time since late January. The importance of such a decline will only be highlighted once the break of the 200-day MA lasts into mid-month. But theres something notable about todays development. It is the first time in the life of the euro that the USD index breaks below its 200-day MA, without EURUSD breaking above its own 200-day MA. The chart below shows EURUSD stands at $1.3230, which is about 3 cents below its 200-day MA. Considering that EUR occupies 57% of the 6-currency basket of the USD index, it can be deduced that the bulk of USDX losses have occurred against the other currencies in the index (JPY, GBP, CHF, CAD and SEK). Indeed, each of these currencies has risen above its 200-day MA against the USD dollar. With the euro lagging behind, this suggests the EURUSD rally is largely the result of USD weakness, which could be explained by lingering sovereign dent worries. But this may also serve a warning signal for the next leg of broad USD weakness once EURUSD breaks above its 200-day MA.

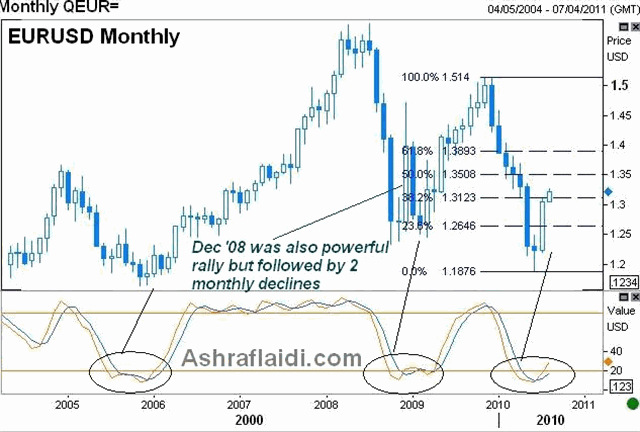
EURUSD has extended its rally across the board after closing above the important $1.3130s resistance. Despite a modest Tuesday pullback in US equities; risk currencies face little resistance in accumulating further ground against USD. EURUSD faces $1.3270 as the next technical target, which is the support from mid March to early April. Contrasting economic data between the US and Eurozone as well as the earnings performances on the banking sector continues to shore up the euro on the premise of broadening stabilization of inter-bank concernsand to a lesser extentrobust recovery in Germany. A little bit more help from Fed rhetoric will be crucial in extending EURUSD to the all-important 200-day MA (now at $1.3575)

For more frequent FX & Commodity calls & analysis, follow me on Twitter Twitter.com/alaidi
By Ashraf Laidi
AshrafLaidi.com
Ashraf Laidi is the Chief FX Analyst at CMC Markets NA. This publication is intended to be used for information purposes only and does not constitute investment advice. CMC Markets (US) LLC is registered as a Futures Commission Merchant with the Commodity Futures Trading Commission and is a member of the National Futures Association.
Ashraf Laidi Archive |
© 2005-2022 http://www.MarketOracle.co.uk - The Market Oracle is a FREE Daily Financial Markets Analysis & Forecasting online publication.


