


Meet Someone Who is 90% Invested in Gold and Silver!
Commodities / Gold and Silver 2010 Aug 02, 2010 - 08:38 AM GMTBy: Peter_Degraaf

 Nations rise when, through inventions and technology they become economically prosperous. They grow as they enlarge their borders and increase in influence, through conquests or by trade. They fall, when the growing need to pay for promises made, and the cost of foreign wars, drains the treasury.
(Charts in this report are courtesy Stockcharts.com unless indicated).
Featured is the daily gold chart. The uptrend is well defined. The month-old correction appears to have run its course. The RSI is at 8 month old support and so is the MACD (green lines). The 50DMA is in positive alignment to the 200DMA (green oval), and the latter is rising at 1.5% per month! A breakout at the blue arrow will turn the short-term trend bullish again, in harmony with the long-term trend.
We are not ‘gold bugs’, neither are we ‘silver bugs’. We are investors who have discovered that when governments and their bankers inflate the money supply, we can protect our assets by converting a portion of our assets into gold and silver.
Featured is a second look at the daily bar chart for gold. This time we concentrate on the Bollinger Bands. Observe that almost every time the BBs are violated, it marks a change in direction. Blue arrows mark bottoms while purple arrows mark tops. The violation from Wednesday’s action provides an important clue for future direction. The green arrow points to the anticipated initial target for this rally. The Hulbert Gold Newsletter Sentiment Index fell to 9.2% last week. (This was its low for 2010). From a contrarian point of view this is ‘gold-bullish.’
This next chart is courtesy Dimitri Speck at Seasonalcharts.com. Dimitri has recently updated this chart, using data that goes back to 1971. As can be seen by this chart, the best time to buy gold is during weakness in June and July. Don’t be left behind! Pay no attention to the deflationists! Where the deflation crowd is making its biggest mistake is in believing Keynesian economic theory: ‘deficits don’t matter’. Actually deficits do matter, as they are almost always inflated away. The two largest drains on the US budget are Social Security and Medicare. Politicians will NOT cut these out (perhaps down – but not out). These and other unfunded liabilities exceed 50 trillion dollars! This guarantees more monetary inflation. It is a matter of historical fact that whenever a government embarks on monetary inflation, the end result has always been the destruction of the currency. There are no exceptions!
Conclusion: Deficits will continue to rise and SO WILL GOLD AND SILVER!
This chart courtesy Economist Michael Pollaro at Trueslant.com shows True Money Supply (pink line) with a year over year increase of + 8.5%. True Money Supply 2 (green line) is rising at a 10% rate YoY. (The word ‘Austrian’ refers to the method used, not to the country of Austria).
True money supply represents the amount of money in the economy that is available for immediate use in exchange. The US Federal Reserve uses a different yardstick in their analysis, and they are thereby able to report a lower rate of monetary increase. Nevertheless, even when we use FED figures we notice a huge watering down of the value of money. When you add water to a glass that is half filled with milk, the color will still be white, but the quality of the liquid will have been ‘watered down’.
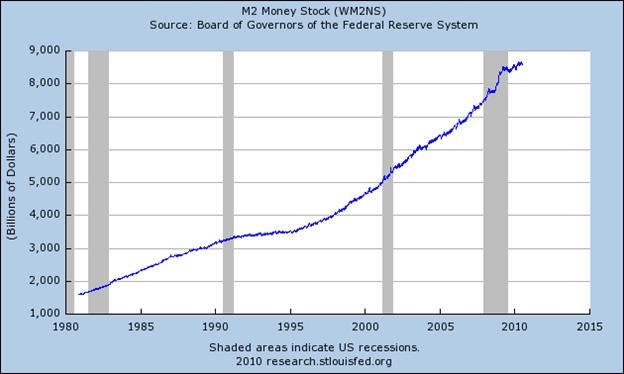
This chart courtesy Federal Reserve Bank of St. Louis shows the M2 money supply has risen at a very rapid rate during the past 30 years. From remarks by Fed Chairman Bernanke we draw the conclusion that the FED is ready to supply still more liquidity should the economy ‘need it’.
We are entering a period in history where massive amounts of wealth will be transferred from one segment of the population to another segment. Investments which appear to be ‘too risky’ for many people will turn out to be hugely successful for the few who dare to take that risk.
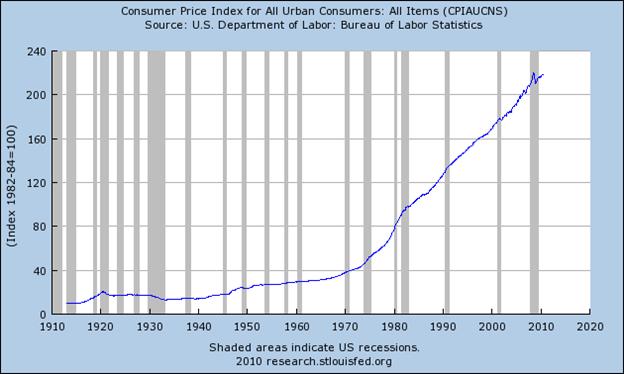
This chart is also courtesy Federal Reserve St. Louis. It shows the rate of price inflation (as admitted to by the FED) to be rising sharply. (If there is no price inflation, somebody forgot to tell the people who maintain this chart). When we use data available at Shadowstats.com we see price inflation at an even higher rate than the rate admitted to by the FED. For that matter, ask any housewife! She’ll tell you that inflation is all around us.
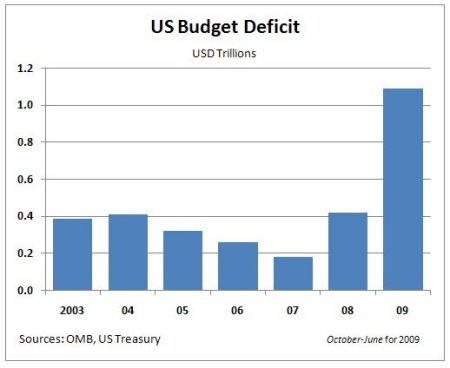
This chart is courtesy of OMB and US Treasury. The White House admitted last week that the budget deficit is still widening. The problem is that politicians are eager to increase spending, going into the November US mid-term elections, and millions of newly unemployed have stopped paying taxes and are drawing support instead. The Federal Reserve under Mr. Greenspan and Mr. Bernanke has been the most accomodating FED in history. Unless you think the Fed Chairman is going to do a 180, these deficits are going to be dealt with in only one manner – newly printed money.
Socialism is irrational, because it lacks a method whereby owners price the assets. Capitalism is rational because it provides owners with a method to price the assets.
This chart courtesy Federal Reserve Bank of St. Louis shows ‘real interest rates’ to be negative. This means anyone with money in the bank, or money invested in T-bills is moving backwards. The money you get back a year hence is worth LESS than the money you put in today. What you need is something that rises faster than the rate of inflation. The solution? Gold and silver!
“Trust God for everything. Trust governments for nothing. Trust gold and silver for the in between.”
Featured is the latest COT report for silver, courtesy Cotpricecharts.com. As expected the ‘net short’ picture improved yet again (The difference between commercial traders long and short positions – purple bars). Friday’s total at 47,000 (compared to 48,000 last week), is similar to the ‘net short’ situation that prevailed late last March. At that time silver was coming off a low at 16.50 and then rose up to 19.75. There are reports that the drop in the price of silver early last week (and the expected further decrease in the ‘net short’ position), has not been included in this COT report. That would make the picture even more bullish.
Featured is the daily bar chart for silver. The uptrend is well defined. The 50DMA is in positive alignment to the 200DMA (green oval), and the latter is rising. Price closed at the top of the daily range on Friday and a breakout at the blue arrow turns the short-term trend bullish, in harmony with the long-term trend.
Featured is the CCI commodity index. Price has just completed an upside breakout at the blue arrow, turning the short-term trend bullish. The green arrow points to the 50DMA which is turning up towards the 200DMA again. Meanwhile the 200DMA is rising strongly. The RSI and MACD are positive. A rising commodity complex is supportive of a rise in gold and silver.
Monetary inflation is an invisible tax. It taxes money on deposit in bank accounts. As this money is ‘watered down’ through inflation, it is then distributed to recipients of government handouts, including bankers and lobbyists. These early recipients benefit from the fact that the dilution is most noticeable further down the line.
Summary:
On Friday July 29th I sent a morning update to my subscribers that indicated I was almost totally invested. 90% in gold and silver, the rest in natural gas. That is what happens when you believe in the reports you produce for your subscribers.
Happy trading!
By Peter Degraaf
Peter Degraaf is an on-line stock trader with over 50 years of investing experience. He issues a weekend report on the markets for his many subscribers. For a sample issue send him an E-mail at itiswell@cogeco.net , or visit his website at www.pdegraaf.com where you will find many long-term charts, as well as an interesting collection of Worthwhile Quotes that make for fascinating reading.
© 2010 Copyright Peter Degraaf - All Rights Reserved
DISCLAIMER: Please do your own due diligence. I am NOT responsible for your trading decisions.
Peter Degraaf Archive |
© 2005-2022 http://www.MarketOracle.co.uk - The Market Oracle is a FREE Daily Financial Markets Analysis & Forecasting online publication.