Using Elliott Wave Theory to Forecast the Financial Markets
InvestorEducation / Elliott Wave Theory Sep 15, 2007 - 05:07 PM GMTBy: EWI
 In the 1930s, Ralph Nelson Elliott , a corporate accountant by profession, studied price movements in the financial markets and observed that certain patterns repeat themselves. He offered proof of his discovery by making astonishingly accurate stock market forecasts. What appears random and unrelated, Elliott said, will actually trace out a recognizable pattern once you learn what to look for. Elliott called his discovery "The Elliott Wave Principle," and its implications were huge. He had identified the common link that drives the trends in human affairs, from financial markets to fashion, from politics to popular culture.
Robert Prechter, Jr. , president of Elliott Wave International , resurrected the Wave Principle from near obscurity in 1976 when he discovered the complete body of R.N. Elliott's work in the New York Library. Robert Prechter, Jr. and A.J. Frost published Elliott Wave Principle in 1978 . The book received enthusiastic reviews and became a Wall Street bestseller. In Elliott Wave Principle, Prechter and Frost's forecast called for a roaring bull market in the 1980s, to be followed by a record bear market. Needless to say, knowledge of the Wave Principle among private and professional investors grew dramatically in the 1980s.
When investors and traders first discover the Elliott Wave Principle, there are several reactions:
- Disbelief – that markets are patterned and largely predictable by technical analysis alone
- Joyous “irrational exuberance” – at having found a “crystal ball” to foretell the future
- And finally the correct , and useful response – “Wow, here is a valuable new tool I should learn to use.”
Just like any system or structure found in nature, the closer you look at wave patterns, the more structured complexity you see. It is structured , because nature's patterns build on themselves, creating similar forms at progressively larger sizes. You can see these fractal patterns in botany, geography, physiology, and the things humans create, like roads, residential subdivisions… and – as recent discoveries have confirmed – in market prices.
Natural systems, including Elliott wave patterns in market charts, “grow” through time, and their forms are defined by interruptions to that growth.
Here's what is meant by that. When your hands formed in the womb, they first looked like round paddles growing equally in all directions. Then, in the places between your fingers, cells ceased growing or died, and growth was directed to the five digits. This structured progress and regress is essential to all forms of growth. That this “punctuated growth” appears in market data is only natural – as Robert Prechter, Jr., the world's foremost Elliott wave expert and president of Elliott Wave International, says, “Everything that thrives must have setbacks.”
 The first step in Elliott wave analysis is identifying patterns in market prices. At their core, wave patterns are simple; there are only two of them: “impulse waves,” and “corrective waves.”
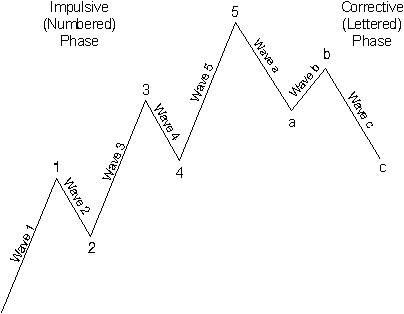
Impulse waves are composed of five sub-waves and move in the same direction as the trend of the next larger size (labeled as 1, 2, 3, 4, 5). Impulse waves are called so because they powerfully impel the market.
A corrective wave follows, composed of three sub-waves , and it moves against the trend of the next larger size (labeled as a, b, c). Corrective waves accomplish only a partial retracement, or "correction," of the progress achieved by any preceding impulse wave.
As the figure to the right shows, one complete Elliott wave consists of eight waves and two phases: five-wave impulse phase, whose sub-waves are denoted by numbers, and the three-wave corrective phase, whose sub-waves are denoted by letters.
What R.N. Elliott set out to describe using the Elliott Wave Principle was how the market actually behaves. There are a number of specific variations on the underlying theme, which Elliott meticulously described and illustrated. He also noted the important fact that each pattern has identifiable requirements as well as tendencies . From these observations, he was able to formulate numerous rules and guidelines for proper wave identification. A thorough knowledge of such details is necessary to understand what the markets can do, and at least as important, what it does not do.
You have only just begun to learn the power and complexity of the Elliott Wave Principle. So, don't let your Elliott wave education end here. Join Elliott Wave International's free Club EWI and access the Basic Tutorial: 10 lessons on The Elliott Wave Principle and learn how to use this valuable tool in your own trading and investing.
By Elliott Wave International
© 1997-2007 Elliott Wave International
Elliott Wave International Archive |
© 2005-2022 http://www.MarketOracle.co.uk - The Market Oracle is a FREE Daily Financial Markets Analysis & Forecasting online publication.


