


Gold Looking Weak, Fridays Action Kills Hope for a Rally
Commodities / Gold and Silver 2010 Jul 18, 2010 - 09:25 AM GMTBy: Merv_Burak

 Friday may have killed any hope of a good rally. Gold is looking weak and the price trend has been weakening for quite some time. Are we at the top?
GENERAL COMMENT
Much has been written over the past few weeks about the fact that gold has made it into new high territory, even I have made some of those comments. But really, it has BARELY entered new highs and for a strong move gold should have risen sharply into much higher levels, real fast after the break. That it did not is a fact for worry. A short hesitation after the break is not unusual but what we are starting to see is more than a short hesitation. It is starting to look like a turn around of trend. More confirmation is required, technically, but at this point the risks are getting a lot larger if one is thinking of investing or speculating on the buy side for gold or stocks. There comes a time when it is just more relaxing to lean back in a nice comfortable chair with feet on a stool, have a beer, watch your favorite program on TV and just wait for a better, less risky period to get back into the market. Relaxing your brain every now and then puts you in a much more advantageous position when you finally get back in.
Now, what are the odds that we are ACTUALLY going to go into a major reversal of trend? Who knows? Of course the same can be said about a continuation on the up side. Technically, we just follow the daily actions of the thousands of informed (and many uninformed) investors who are putting their money on the line and follow their example, where it strongly suggests a trend. We hope that the trends they set will continue into the future so we stick with them until the technicals actually confirm that reversal of trend has occurred.
GOLD
LONG TERM
Since changing the units and reversal criteria for my long term gold P&F chart the trend continues to be bullish. At the present time the price would have to drop to the $1110 level before we start to worry, long term P&F wise.
There is always the P&F chart and the daily or weekly bar or candlestick chart. Not only do the two often give us a different message but the bar or candlestick chart alone could give us a varying message depending upon what indicators we are using with the chart or what patterns we are looking at. That’s why I like to keep it simple using only simple indicators that have proven themselves over many, many years of usage. Sophisticated, complicated, or just downright difficult indicators or techniques are just too stressful on the brain. So, let’s continue with the simple.
To gauge where we are at, with technical indicators, I look at three things; trend, momentum (strength of trend) and often, but not always, volume of activity. That’s enough for the simple. I throw in a trend line or a pattern where appropriate.
Going to the long term indicators gold remains above its positive sloping moving average line. However, the latest direction of motion is towards the line and it would not be much longer for gold to cross below the line if we continue with downside days. The long term strength of the price trend, as shown by my long term momentum indicator, remains positive although here too the direction is towards the neutral level. The weakening strength can be seen by the fact that the momentum indicator is now almost at the level it was at during the late Feb lows. Also, the momentum indicator is below its negative sloping trigger line so although positive it is heading in a negative direction. The volume indicator is showing the greatest strength at this time but as I have cautioned before, too often the volume indicator is a lagging indicator at market tops so one should view this positive volume indicator with some skepticism. All in all the long term rating, at this time, is still BULLISH but weakening quite rapidly.
INTERMEDIATE TERM
DARN
Just as I finished the title (above) a violent storm went through and knocked out the power in my area. That was just after 1:00 P.M. Saturday afternoon. The power was not restored until some 10 to 14 hours later in the middle of the night. So, I’m way behind schedule with the commentary. I’ll limit the rest to only the gold portion and get back on track next week.
Now, where was I before the storm?
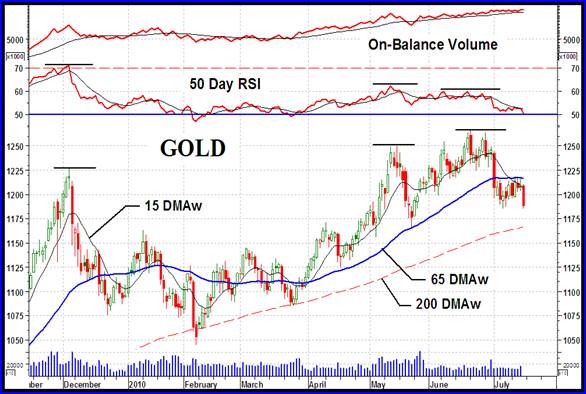
Since I’m cutting the commentary today to only gold I thought I should at least show the full gold chart from the intermediate term standpoint. Here we have the trend (moving average lines), the momentum (50 day RSI) and volume indicator (On-Balance Volume). The momentum and volume indicators also show my trigger lines. Today, let’s just take an extra look at the momentum indicator.
At the price peak in early Dec the momentum (strength) of the price move was quite strong with the indicator entering its overbought zone. The subsequent decline in the momentum was normal after such a strong move. Although the momentum went negative for a few days it quickly recovered. As the price rallied from its Feb low to its new high in May the momentum also gained strength but on a very limited basis. It hit a peak in May that was just slightly better than half of its strength at the Dec peak. The next price move from its May low to its new high in June was accompanied by still weaker momentum performance. The strength of the price move to new highs was weakening drastically. Now, with relatively little downside in the price move we are just about to enter the negative zone with the momentum. Is there anyone out there that cannot understand the direction that the momentum of the price movement is heading into?
So, let’s just quickly summarize the simple indicators. Gold is trading below its now negative sloping moving average line (65 DMAw). The momentum indicator is still very slightly above its neutral line in the positive zone but heading lower fast. It is, however, below its negative sloping trigger line. The volume indicator is still the strong indicator being above its positive trigger line but as often cautioned, it could be a lagging indicator at market tops. Putting all this together I must rate the intermediate term as BEARISH now. The short term moving average line (15 DMAw) is now below the intermediate term line for confirmation of the bear.
SHORT TERM
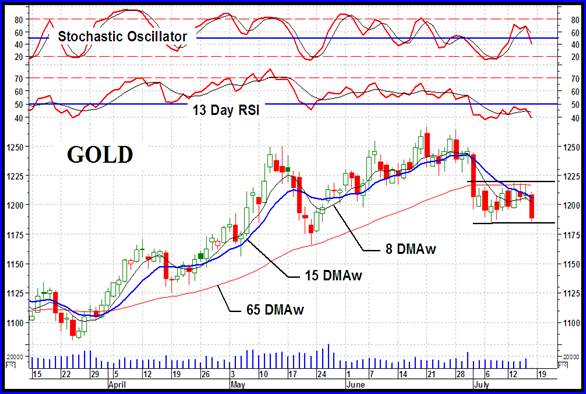
Back in the 1950s a professional dancer called Nicolas Darvas made a killing in the stock market. He might have even made more money with his 1960 best seller “How I Made $2,000,000 in the Stock Market”. We see here in the short term chart one of his most popular trading patterns, the “box”. The box is an area of price activity with an upper resistance and lower support. The breaking of the box by subsequent price action was Nicolas’s signal to trade with the break-out. Traders even to this day still look for this pattern to trade with. Will gold break below the support or rally and break above the resistance? It does look like the support will be broken but we’ll have to wait for the actual event, as Nicolas did.
For now let’s just quickly summarize where we stand from the short term perspective. During the week gold tried to break above the short term moving average line but the attempts failed. It continues to trade below the line and the line continues to slope downwards. The momentum indicator (13 Day RSI) remains in its negative zone and although it tried to gain altitude during the week and moved above its trigger line it is once more below its now negative sloping trigger. The daily volume action is pretty low and not giving us any real message other than the speculators are sort of holding back their activities. Summarizing, I can only rate the short term as BEARISH. The very short term moving average line remains below the short term line for confirmation of the bear.
As for the immediate direction of least resistance, well the Friday action was quite negative with the close being very near the low for the day. The aggressive Stochastic Oscillator (another momentum type indicator) is heading lower fast and although it has already entered its negative zone it still has a way to go to get to its oversold zone. I’ll go with the down side as the direction of least resistance, at least for the next couple of days.
Merv’s Precious Metals Indices Table
Well, that’s another week.
By Merv Burak, CMT
Hudson Aero/Systems Inc.
Technical Information Group
for Merv's Precious Metals Central
For DAILY Uranium stock commentary and WEEKLY Uranium market update check out my new Technically Uranium with Merv blog at http://techuranium.blogspot.com .
During the day Merv practices his engineering profession as a Consulting Aerospace Engineer. Once the sun goes down and night descends upon the earth Merv dons his other hat as a Chartered Market Technician ( CMT ) and tries to decipher what's going on in the securities markets. As an underground surveyor in the gold mines of Canada 's Northwest Territories in his youth, Merv has a soft spot for the gold industry and has developed several Gold Indices reflecting different aspects of the industry. As a basically lazy individual Merv's driving focus is to KEEP IT SIMPLE .
To find out more about Merv's various Gold Indices and component stocks, please visit http://preciousmetalscentral.com . There you will find samples of the Indices and their component stocks plus other publications of interest to gold investors.
Before you invest, Always check your market timing with a Qualified Professional Market Technician
Merv Burak Archive |
© 2005-2022 http://www.MarketOracle.co.uk - The Market Oracle is a FREE Daily Financial Markets Analysis & Forecasting online publication.