


Investors Intelligence Stock Market Sentiment Indicator, Be Careful What You Wish For
Stock-Markets / Stock Market Sentiment Jul 16, 2010 - 01:46 AM GMTBy: Guy_Lerner

 File this article from Bloomberg under "the be careful what you wish for" column. The article highlights market sentiment data from Investors Intelligence, and for the first time since March, 2009, there are more bearish newsletter writers than bullish ones. While the article wishes this was a good thing, the entirety of the data series would suggest that it is not so simple.
Figure 1 is a weekly chart of the S&P500 with the Investors Intelligence data in the lower panel. The green line is the bullish percentage and the red line is for the bears. As the article suggests there are now more bears than bulls and of course, this is just another reason why the stock market is going higher. But rather than be wishful let's look at the data in its entirety, and when it comes to Investors Intelligence that is a good thing because the data goes all the way back to 1969.
Figure 1. S&P500/ weekly
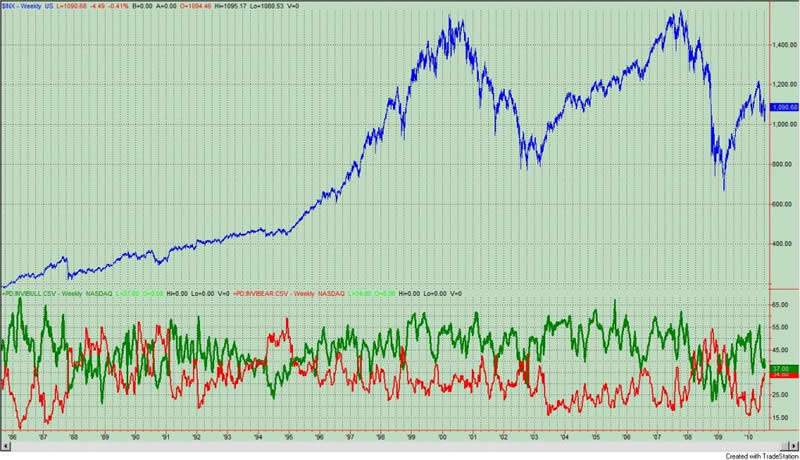
So let's construct a simple strategy: let's buy the S&P500 when the number of bears exceeds the number of bulls; this is the red line greater than the green line in figure 1. We will close our position when there are more bulls than bears or when the green line is greater than the red line This is a simple enough strategy that produced the following equity curve. See figure 2.
Figure 2. Equity Curve
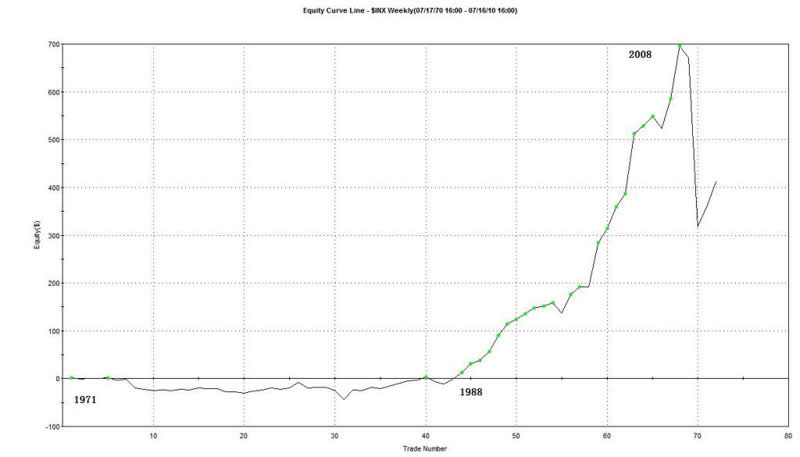
Since 1971, such a strategy produced 72 trades; there were 49 winners and 23 losers. The ratio of the average winning trade to the average losing trade was .84. There were fewer losers but they tended to be bigger losses on average than the winners. But look at figure 2 more closely. From 1971 to 1988 this strategy made no money. From 1988 to 2008, the strategy performed admirably (or in a parabolic fashion), but starting in 2008, this strategy suffered its first significant pull back in 20 years.
As you can see, more bears than bulls isn't quite so simple.
By Guy Lerner
http://thetechnicaltakedotcom.blogspot.com/
Guy M. Lerner, MD is the founder of ARL Advisers, LLC and managing partner of ARL Investment Partners, L.P. Dr. Lerner utilizes a research driven approach to determine those factors which lead to sustainable moves in the markets. He has developed many proprietary tools and trading models in his quest to outperform. Over the past four years, Lerner has shared his innovative approach with the readers of RealMoney.com and TheStreet.com as a featured columnist. He has been a regular guest on the Money Man Radio Show, DEX-TV, routinely published in the some of the most widely-read financial publications and has been a marquee speaker at financial seminars around the world.
© 2010 Copyright Guy Lerner - All Rights Reserved
Disclaimer: The above is a matter of opinion provided for general information purposes only and is not intended as investment advice. Information and analysis above are derived from sources and utilising methods believed to be reliable, but we cannot accept responsibility for any losses you may incur as a result of this analysis. Individuals should consult with their personal financial advisors.
Guy Lerner Archive |
© 2005-2022 http://www.MarketOracle.co.uk - The Market Oracle is a FREE Daily Financial Markets Analysis & Forecasting online publication.