Falling Percentage of Trending Stocks on the NYSE
Stock-Markets / Stock Markets 2010 Jun 30, 2010 - 12:01 PM GMTBy: Donald_W_Dony
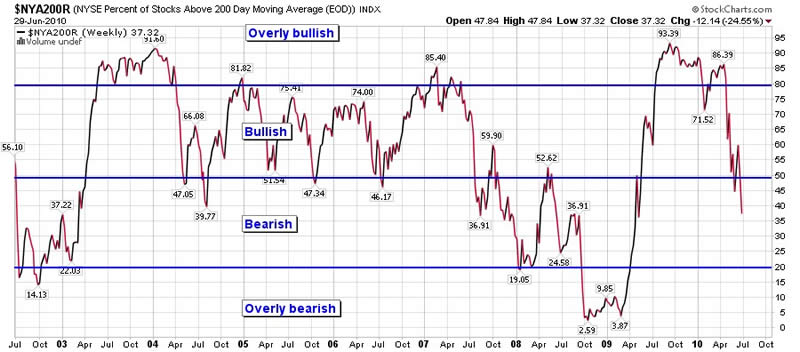
The percentage of stocks that are trending up on the NYSE Composite continues to fall. The number of equities on the Big Board that are trading above their long-term 200-day moving average has declined to about 37% (Chart 1). This means the majority of stocks are now descending. A reading of below 50% suggest a stronger correction is developing. Models illustrate that downward pressure is building as the 16-week cycle unfolds.
This dominant pattern of the markets indicates that the next major low is expected in September. Weak percentage support in the early part of the cycle suggests a continual deterioration can be anticipated until the low in September. Probability models indicate the percentage of stocks trending up should drop to about 20% by September.

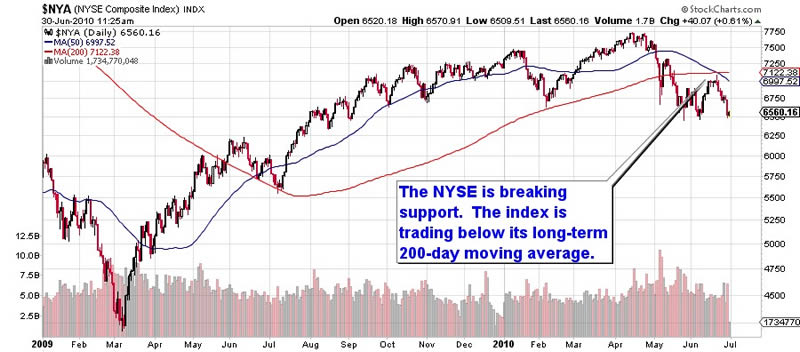
Bottom line: As the percentage of stocks trending up continues to fall, so does the support for the NYSE Composite. And with three more months before the expected low arrives for the index, the number of equities that are currently trending up (37.32%) is anticipated to fall even lower. Chart 2 of the NYSE Composite, shows the index breaking key support and trading below its 200-day moving average for the first time in the bull market. The much watched 50-day moving average has now declined down through the 200-day m/a. This creates what many traders call a "Bear Cross' and implies a greater probability of lower markets in the near term.

Investment approach: Investors may wish to remain out of the markets until the expected September low arrives. Any short-term bounces in the markets can be used to increase cash positions by selling securities. A defensive stance is suggested over the next three months.
After the anticipated trough develops, the 4th quarter should be a return to the bull market. 50 years of historical data indicates that the period from late October into January, particularly in a mid-term election year, provides stronger performing markets.
More research will be in the upcoming July newsletter.
Your comments are always welcomed.
By Donald W. Dony, FCSI, MFTA
www.technicalspeculator.com
COPYRIGHT © 2010 Donald W. Dony
Donald W. Dony, FCSI, MFTA has been in the investment profession for over 20 years, first as a stock broker in the mid 1980's and then as the principal of D. W. Dony and Associates Inc., a financial consulting firm to present. He is the editor and publisher of the Technical Speculator, a monthly international investment newsletter, which specializes in major world equity markets, currencies, bonds and interest rates as well as the precious metals markets.
Donald is also an instructor for the Canadian Securities Institute (CSI). He is often called upon to design technical analysis training programs and to provide teaching to industry professionals on technical analysis at many of Canada's leading brokerage firms. He is a respected specialist in the area of intermarket and cycle analysis and a frequent speaker at investment conferences.
Mr. Dony is a member of the Canadian Society of Technical Analysts (CSTA) and the International Federation of Technical Analysts (IFTA).
Donald W. Dony Archive |
© 2005-2022 http://www.MarketOracle.co.uk - The Market Oracle is a FREE Daily Financial Markets Analysis & Forecasting online publication.


