


Stock Market Investor Sentiment Story Continues
Stock-Markets / Stock Markets 2010 Jun 28, 2010 - 11:17 AM GMTBy: Guy_Lerner

 When we last looked at investor sentiment, I had noted that bearish sentiment (i.e., bull signal) had given way to a more neutral reading. In essence, equities would need to rise on their own merit, and with the fundamental storm clouds gathering - i.e., talk of a double dip recession is escalating -it is not clear to me what the drivers for higher prices will be. Nonetheless, the market's inability to stage a rally at this juncture here is important as failed signals carry significance.
The current signal has not failed yet, but I have defined what a failed signal would look like. Last week's price action, which appears to be consistent with the fundamental picture, tested that failure point.
One could make the argument from a technical perspective - and I believe that I have done so -that the market is a compelling buy here. Prices are at support and expectations aren't high. This is a low risk entry here with the potential to exceed expectations. On the other hand we can ask: is this set up still compelling knowing the fundamental and economic outlook? This is a question you need to answer.
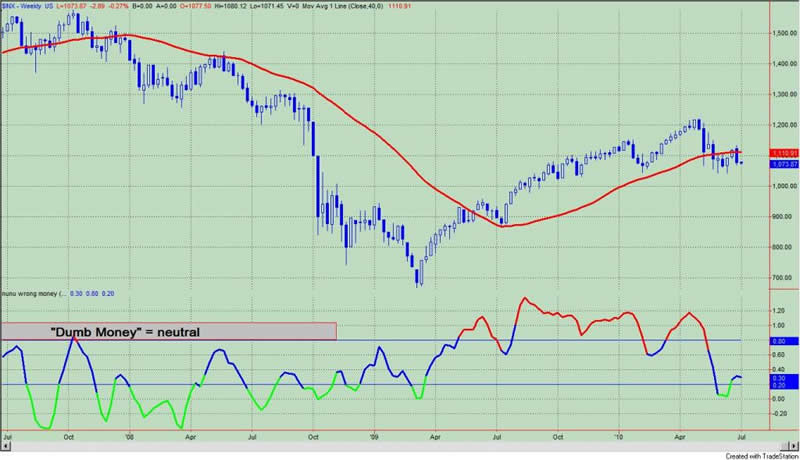
The "Dumb Money" indicator (see figure 1) looks for extremes in the data from 4 different groups of investors who historically have been wrong on the market: 1) Investor Intelligence; 2) Market Vane; 3) American Association of Individual Investors; and 4) the put call ratio. The "Dumb Money" indicator is neutral
Figure 1. "Dumb Money"/ weekly
The "Smart Money" indicator is shown in figure 2. The "smart money indicator is a composite of the following data: 1) public to specialist short ratio; 2) specialist short to total short ratio; 3) SP100 option traders. As of this past Friday, the "Smart Money" indicator is neutral.
Figure 2. "Smart Money"/weekly
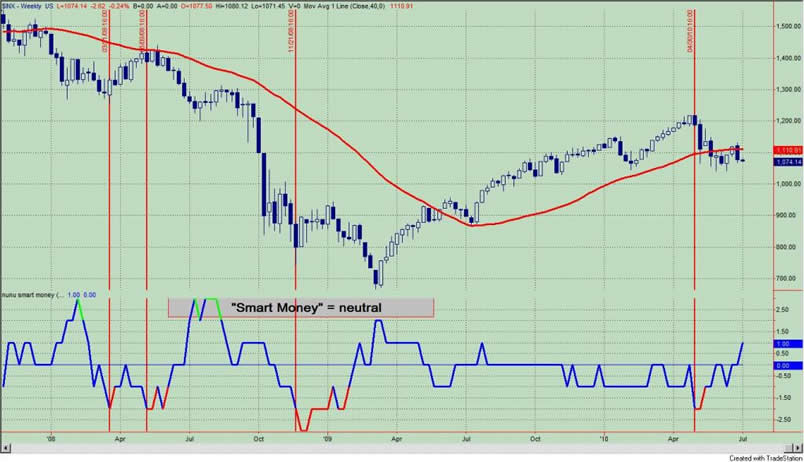
Figure 3 is a weekly chart of the S&P500 with the InsiderScore "entire market" value in the lower panel. From the InsiderScore weekly report we note the same lack of conviction that has plagued this bounce for the prior 4 weeks continues this week.
Figure 3. InsiderScore "Entire Market" Value/ weekly
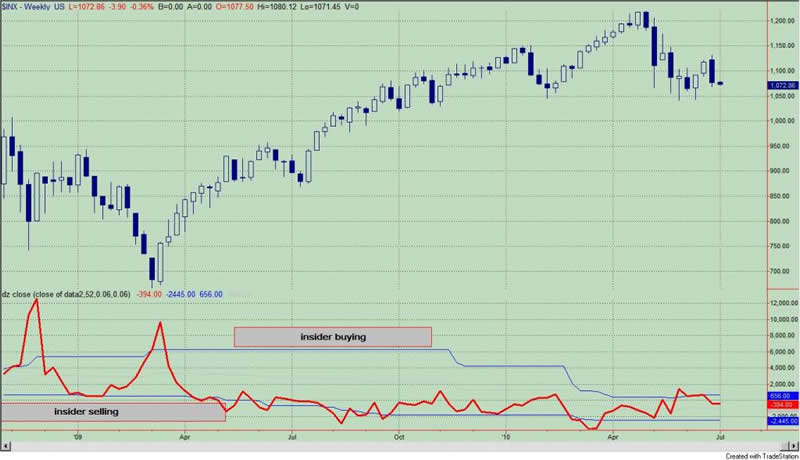
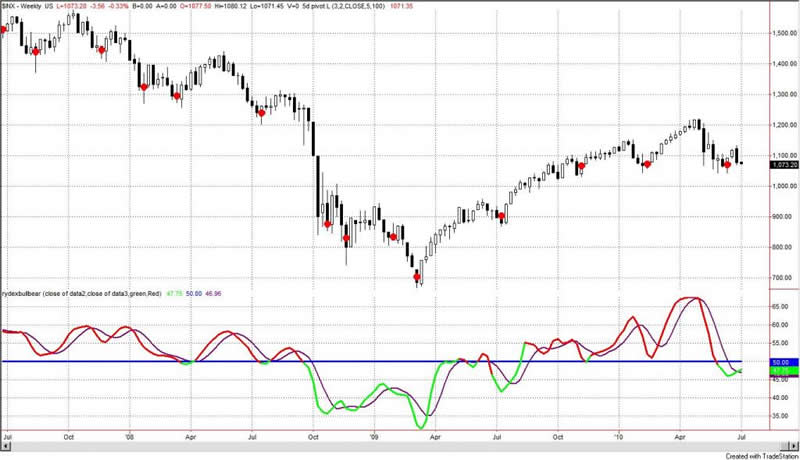
Figure 4 is a weekly chart of the S&P500. The indicator in the lower panel measures all the assets in the Rydex bullish oriented equity funds divided by the sum of assets in the bullish oriented equity funds plus the assets in the bearish oriented equity funds. When the indicator is green, the value is low and there is fear in the market; this is where market bottoms are forged. When the indicator is red, there is complacency in the market. There are too many bulls and this is when market advances stall.
Currently, the value of the indicator is 47.75%. Values less than 50% are associated with market bottoms.
Figure 4. Rydex Total Bull v. Total Bear/ weekly
Were you buying at the market top? Wondering when to buy the dip?
Improve your market timing withPremium Content from TheTechnicalTake. For a nominal yearly fee, you will get a unique data set that will show you which way investors (i.e., bull market geniuses) are leaning.
It is independent and original market analysis. To view a recent report click: REPORT.
By Guy Lerner
http://thetechnicaltakedotcom.blogspot.com/
Guy M. Lerner, MD is the founder of ARL Advisers, LLC and managing partner of ARL Investment Partners, L.P. Dr. Lerner utilizes a research driven approach to determine those factors which lead to sustainable moves in the markets. He has developed many proprietary tools and trading models in his quest to outperform. Over the past four years, Lerner has shared his innovative approach with the readers of RealMoney.com and TheStreet.com as a featured columnist. He has been a regular guest on the Money Man Radio Show, DEX-TV, routinely published in the some of the most widely-read financial publications and has been a marquee speaker at financial seminars around the world.
© 2010 Copyright Guy Lerner - All Rights Reserved
Disclaimer: The above is a matter of opinion provided for general information purposes only and is not intended as investment advice. Information and analysis above are derived from sources and utilising methods believed to be reliable, but we cannot accept responsibility for any losses you may incur as a result of this analysis. Individuals should consult with their personal financial advisors.
Guy Lerner Archive |
© 2005-2022 http://www.MarketOracle.co.uk - The Market Oracle is a FREE Daily Financial Markets Analysis & Forecasting online publication.