


Stock Market Stalls At Resistance
Stock-Markets / Stock Markets 2010 Jun 18, 2010 - 03:28 AM GMT

 U.S. stocks rose as a late-day rally in technology, consumer-staples and industrial companies
helped the market overcome an early slump spurred by economic reports that cast doubts on the
strength of the recovery.
U.S. stocks rose as a late-day rally in technology, consumer-staples and industrial companies
helped the market overcome an early slump spurred by economic reports that cast doubts on the
strength of the recovery.
The Standard & Poor’s 500 Index increased 0.1 percent to 1,116.01 at 4 p.m. in New York and remained above its 200-day average for a third day. The Dow Jones Industrial Average gained 24.71 points, or 0.2 percent, to 10,434.17, erasing a drop of as much as 90 points. Both gauges did not turn higher until the final minutes of trading.
Did the BP Oil Well Really Blow Out in February, Instead of April? The Deepwater Horizon blew up on April 20th, and sank a couple of days later. BP has been criticized for failing to report on the seriousness of the blow out for several weeks. However, as a whistleblower previously told 60 Minutes, there was an accident at the rig a month or more prior to the April 20th explosion.As Bloomberg reports today, problems at the well actually started in February: “BP Plc was struggling to seal cracks in its Macondo well as far back as February, more than two months before an explosion killed 11 and spewed oil into the Gulf of Mexico.”
That may explain Goldman’s and the BP executives’ massive sale of shares in March. ICI Reports Another Massive Equity Outflow (ZeroHedge) As we predicted previously, in the past week domestic equity mutual funds experienced another whopper of a redemption. ICI reports that for the week ended June 9, domestic equity mutual funds saw $3.7 billion in outflows, 3 times the prior week's outflow, the sixth sequential outflow in a row, and $27 billion in outflows year to date.
The VIX makes a new low.
 -- It seems as if the VIX and the
dollar are paired together in their
cycles. Both have pivot days due
tomorrow. The VIX remains below
its intermediate-term Trend Support
at 31.18 today. We had been due for
a Trading Cycle low last Friday, but
it seems that the VIX is off by a full
pivot cycle. It may have to do with
options expiration, since a decline in
equities this week would have caused
a lot of damage.
-- It seems as if the VIX and the
dollar are paired together in their
cycles. Both have pivot days due
tomorrow. The VIX remains below
its intermediate-term Trend Support
at 31.18 today. We had been due for
a Trading Cycle low last Friday, but
it seems that the VIX is off by a full
pivot cycle. It may have to do with
options expiration, since a decline in
equities this week would have caused
a lot of damage.
The CBOE Put-Call Ratio for equities ($CPCE) rose to .89 today. The pros remained resumed a neutral position in the $CPCI at .94 at the end of the day. The 10- day average is still 1.44. The NYSE Hi-Lo index closed up 16 points today to 44. The Hi-Lo index remains in bearish territory. Bullish territory begins at 95.
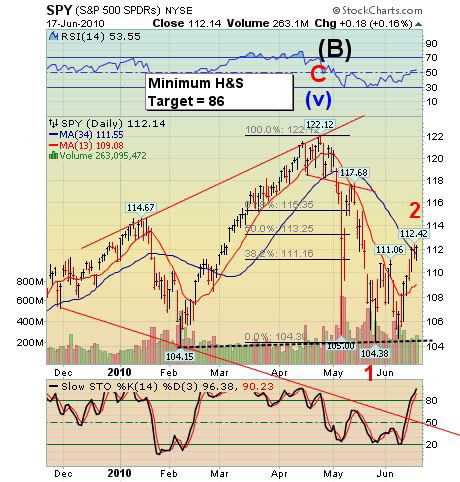
SPY remain stalled above intermediate-term Resistance.
 Action: Sell/Short/Inverse
-- The SPY stayed above
intermediate-term Trend Resistance
at 111.55 today. There is strong
overhead Model and Fibonacci
Resistance at 113.20-113.26,
although SPY may not choose to
challenge it. All of the common
wave relationships have been met in
this rally, so technically it is finished.
Monday’s pivot day was also the top
of a five-wave pattern. What
happened since then appears to be a
double zig-zag extension. This may
have served two purposes. First, to
fill the gap left in the May decline,
and second, to keep shares elevated
through options week.
Action: Sell/Short/Inverse
-- The SPY stayed above
intermediate-term Trend Resistance
at 111.55 today. There is strong
overhead Model and Fibonacci
Resistance at 113.20-113.26,
although SPY may not choose to
challenge it. All of the common
wave relationships have been met in
this rally, so technically it is finished.
Monday’s pivot day was also the top
of a five-wave pattern. What
happened since then appears to be a
double zig-zag extension. This may
have served two purposes. First, to
fill the gap left in the May decline,
and second, to keep shares elevated
through options week.
QQQQ closes above intermediate-term Trend Resistance.
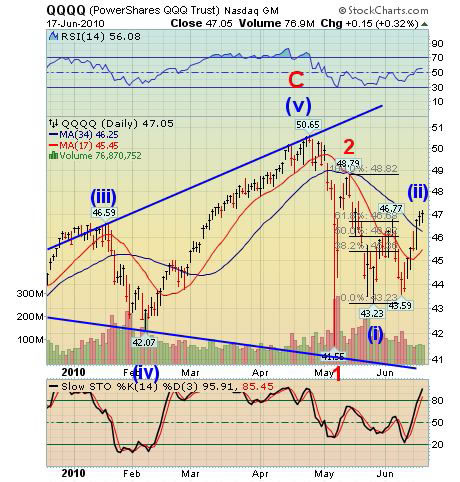 Action: Sell/Short/Inverse
-- Today QQQQ made a small gain
above its intermediate-term Trend
Resistance at 46.25 again.
The rally in the last half-hour to close
the market on a positive note is
something one would expect in a
market like this. Notice how we are
not getting any more “sneak peeks”
into expected earnings due to be
released next month. I wonder why?
Action: Sell/Short/Inverse
-- Today QQQQ made a small gain
above its intermediate-term Trend
Resistance at 46.25 again.
The rally in the last half-hour to close
the market on a positive note is
something one would expect in a
market like this. Notice how we are
not getting any more “sneak peeks”
into expected earnings due to be
released next month. I wonder why?
XLF stalled below Resistance.
 Action: Sell/Short/Inverse
-- XLF remains stalled just below its
intermediate-term Trend Resistance
at 14.97. The very weak rally gives
many indications that it may be
finished here as an irregular
correction.
Action: Sell/Short/Inverse
-- XLF remains stalled just below its
intermediate-term Trend Resistance
at 14.97. The very weak rally gives
many indications that it may be
finished here as an irregular
correction.
Today’s action left a probable reversal pattern in both the hourly and daily charts. Remember, XLF has been the “lead dog” in the decline.
FXI makes a small pullback.
 Action: Buy/Long
-- FXI took a rest in its rally as shortterm
Trend Support rose to 39.60
today. Short-term Trend Support has
made a bullish cross. Although I do
not expect a larger correction yet,
there is a good probability that shortterm
Trend Support will be our
safety net for a while, now that the
rally is underway.
$SSEC has attempted to cross shortterm
Trend Resistance at 2573, but
has not yet succeeded.
Action: Buy/Long
-- FXI took a rest in its rally as shortterm
Trend Support rose to 39.60
today. Short-term Trend Support has
made a bullish cross. Although I do
not expect a larger correction yet,
there is a good probability that shortterm
Trend Support will be our
safety net for a while, now that the
rally is underway.
$SSEC has attempted to cross shortterm
Trend Resistance at 2573, but
has not yet succeeded.
GLD’s attempted a breakout.
 Action: Buy/Long
-- GLD very nearly succeeded at its
attempted break-out today. It
remains above its short-term Trend
Support at 120.13. It’s funny what a
24-hour time span in the market will
do.
Two observations come to mind.
The first is that the GLD cycle seems
to be paired with TLT, its diametric
opposite. You almost have to be a
manic-depressive to own both. The
second item is that GLD could have a
nice run once it breaks out again.
However, 126 is a strong resistance
area. I would like to see what
happens when GLD gets there.
Action: Buy/Long
-- GLD very nearly succeeded at its
attempted break-out today. It
remains above its short-term Trend
Support at 120.13. It’s funny what a
24-hour time span in the market will
do.
Two observations come to mind.
The first is that the GLD cycle seems
to be paired with TLT, its diametric
opposite. You almost have to be a
manic-depressive to own both. The
second item is that GLD could have a
nice run once it breaks out again.
However, 126 is a strong resistance
area. I would like to see what
happens when GLD gets there.
USO back-tested its trendline.
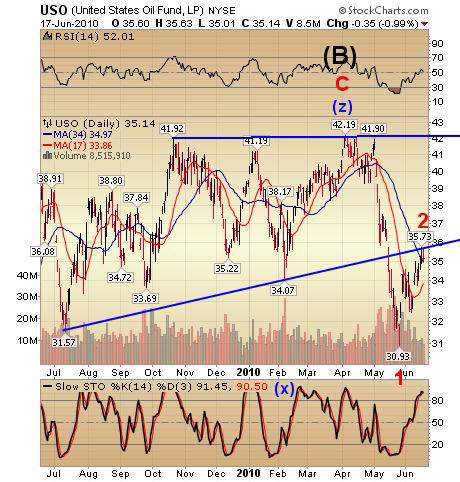 Action: Sell/Short/Inverse
-- USO eased down from a back-test
of its year-old bearish wedge
trendline to its intermediate-term
Trend Resistance at 34.97, giving
credence that the rally is all but over.
It just happens that Cycle Resistance
is at 35.70 as well. The reversal
pattern in the hourly chart got its
follow-through today. The wave
pattern is also complete.
Action: Sell/Short/Inverse
-- USO eased down from a back-test
of its year-old bearish wedge
trendline to its intermediate-term
Trend Resistance at 34.97, giving
credence that the rally is all but over.
It just happens that Cycle Resistance
is at 35.70 as well. The reversal
pattern in the hourly chart got its
follow-through today. The wave
pattern is also complete.
USO may be entering a prolonged decline that could last up to six weeks, since the next Primary Cycle low is scheduled to come in the last week of July.
TLT emerged above its triangle pattern.
 Action: Buy/Long
-- TLT has emerged above its
triangle pattern and short-term Trend
Support at 97.10. The triangle
pattern virtually assures new highs
with a minimum potential target of
100.70.
My model still suggests a high of
105.40. However, the 61.8%
retracement level is 104.20. Another
major newsletter is calling for an
even higher number, but I will stick
to my range for now.
The message for now is that TLT
will make a new high before we must
be concerned about a reversal.
Action: Buy/Long
-- TLT has emerged above its
triangle pattern and short-term Trend
Support at 97.10. The triangle
pattern virtually assures new highs
with a minimum potential target of
100.70.
My model still suggests a high of
105.40. However, the 61.8%
retracement level is 104.20. Another
major newsletter is calling for an
even higher number, but I will stick
to my range for now.
The message for now is that TLT
will make a new high before we must
be concerned about a reversal.
UUP prepares for a pivot day.
 Action: Buy/Long
-- UUP pulled back below
intermediate-term Trend Support at
25.11 today. It has also made a
reversal pattern using Cycle Support
at 24.90 today. The next UUP pivot
is tomorrow.
Action: Buy/Long
-- UUP pulled back below
intermediate-term Trend Support at
25.11 today. It has also made a
reversal pattern using Cycle Support
at 24.90 today. The next UUP pivot
is tomorrow.
Putting it all together, this suggests that the reversal will happen no later than Monday and the crash scenario that I have been discussing will get underway either on June 21st or June 28th.
Have a great evening!
Tony
Anthony M. Cherniawski
Traders alert: The Practical Investor is currently offering the daily Inner Circle Newsletter to new subscribers. Contact us at tpi@thepracticalinvestor.com for a free sample newsletter and subscription information.
Our Investment Advisor Registration is on the Web
We are in the process of updating our website at www.thepracticalinvestor.com to have more information on our services. Log on and click on Advisor Registration to get more details.
If you are a client or wish to become one, please make an appointment to discuss our investment strategies by calling Connie or Tony at (517) 699-1554, ext 10 or 11. Or e-mail us at tpi@thepracticalinvestor.com .
Anthony M. Cherniawski, President and CIO http://www.thepracticalinvestor.com
As a State Registered Investment Advisor, The Practical Investor (TPI) manages private client investment portfolios using a proprietary investment strategy created by Chief Investment Officer Tony Cherniawski. Throughout 2000-01, when many investors felt the pain of double digit market losses, TPI successfully navigated the choppy investment waters, creating a profit for our private investment clients. With a focus on preserving assets and capitalizing on opportunities, TPI clients benefited greatly from the TPI strategies, allowing them to stay on track with their life goals
Disclaimer: The content in this article is written for educational and informational purposes only. There is no offer or recommendation to buy or sell any security and no information contained here should be interpreted or construed as investment advice. Do you own due diligence as the information in this article is the opinion of Anthony M. Cherniawski and subject to change without notice.
Anthony M. Cherniawski Archive |
© 2005-2022 http://www.MarketOracle.co.uk - The Market Oracle is a FREE Daily Financial Markets Analysis & Forecasting online publication.