


Psychology of the Copper Market, Implications for the Global Economy
Commodities / Metals & Mining Jun 16, 2010 - 11:53 AM GMTBy: Gary_Dorsch

 Copper is often referred to as the metal with a Ph-D in macro-Economics, since it finds its way into so many industrial applications, including automobiles, appliances, airplanes, pipes, wires, and even computer chips, to mention just a few of its uses. As such, it acts as a top forecaster of where the global economy is heading next, especially China, Asia’s economic locomotive. Copper is a favorite tool for speculators in the commodities markets, given its cyclical nature and volatility.
Copper has been on a wild rollercoaster ride over the past several years, famous for its “boom-and-bust” cycles. Gambling on copper’s next major move is always a high stakes bet. But “in the long run,” Jesse Livermore, the world’s most famous trader used to say, “Commodity prices are governed but by one law -- the economic law of demand and supply. The business of the trader in commodities is simply to get facts about the demand and the supply, present and prospective,” he said.
“It may be possible to use fictitious arguments for or against a certain trend in a commodity market; but success will be only temporary, for in the end, the facts are bound to prevail, so that a trader gets dividends on study and observation, as he does in a regular business. He can watch and weigh conditions, and he knows as much about it as anyone else. He does not indulge in guesses about a dozen things. It always appealed to me trading in commodities,” Livermore added.
 However, the copper market wasn’t observing the basic laws of supply and demand in 2009, when it gained 140-percent. Instead, copper dealers found it profitable to focus solely on the demand side, while largely ignoring the supply side of the equation. After-all, “the market value of any commodity is only worth, what the highest bidder is willing to pay.” Nowadays, what matters most is China’s demand for the red-metal, since it single-handedly buys about 35% of the global supply.
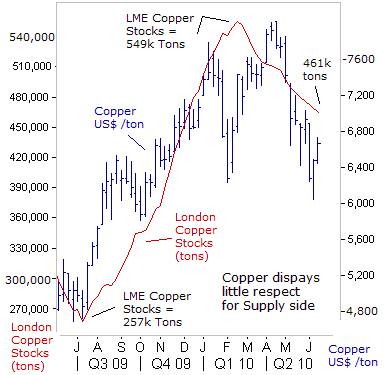
Commodity traders are questioning whether Professor Copper has actually earned his college degree in Economics. Copper prices soared by 60% to as high as $7,700 /ton in London in the second half of 2009, despite a simultaneous build-up of supply in warehouses in London and Shanghai’s Futures Exchange. Typically, rising inventories are a sign of supply outstripping demand and is taken as a bearish signal for prices. Yet the build-up of supply couldn’t put a dent in copper’s mettle.
Copper traders said the bullish view was justified, because of a new phenomenon, called “contango financing,” in which the warehousing of base metals, and the financing of miners, has become increasingly intertwined. Investment bankers discovered a new way to earn millions of dollars, by buying the metal cheaply in the cash market, and selling it at higher prices in the forward market, - thus earning the difference. Much of the copper stored in LME warehouses was linked to “contango financing,” and was already earmarked for future delivery to bona-fide end-users.
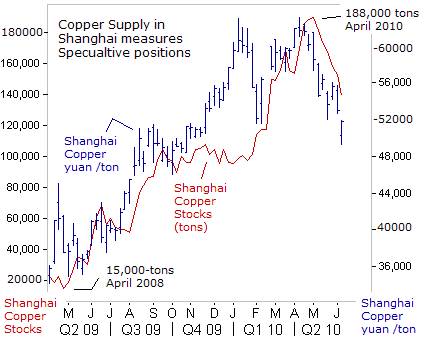
Copper supplies in Shanghai warehouses were also growing rapidly, hitting a six-year high of 188,000-tons in April. Yet mounting supply couldn’t deter the red-metal’s explosive surge to 63,300-yuan /ton. Instead, the increasing supply of copper in Chinese warehouses appears to be acting like an indicator of the amount of open interest in the metal, by speculators betting on strong demand. China bought 3.9-million tons of copper in the first 11-months of 2009, up 67% from a year earlier, to feed the Politburo’s $586-billion spending spree on infrastructure projects.
 However, copper prices began to turn sharply lower in April and May, linked to worries about the Euro zone’s debt crisis, and a gutsy decision by the People’s Bank of China (PBoC), to lift reserve ratios for the country’s largest banks to 17-percent of deposits. In addition, the PBoC has drained nearly 1-trillion yuan out of the Shanghai money market, through open market operations. Speculators began to dump the red-metal into the cash market, and the supply of copper held in local warehouses began to fall to 139,300-tons last week.
On June 10th, the Chinese authorities revealed to the public what many dealers already knew, - Chinese imports of copper had fallen 9.1% in May to 436,345-tons, after a monthly fall of 4.4% in April. Beijing wasn’t interested in stockpiling the red-metal, at prices above 52,000-yuan /ton. As Jesse Livermore used to say, “The market will tell the speculator when he is wrong, because he is losing money. When he first realizes he is wrong, it’s the time to clear out, take his losses, study the record to determine the cause of his error, and await the next big opportunity. Chances are that you will not become acquainted with that reason until some time in the future, when it is too late to act on it profitably,” he said.
First Cracks in the Copper rally,
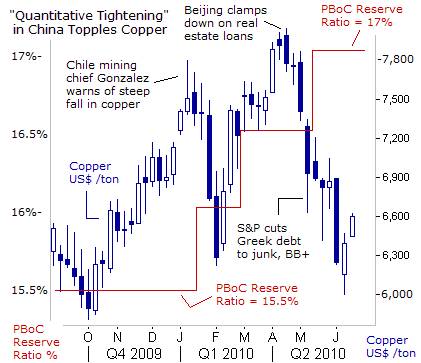
The parabolic rally in the copper market began to show the first signs of fatigue on Jan 11th when Chile’s mining chief Santiago Gonzalez warned that copper prices could see an “important” downward correction. “We are worried that stock levels are climbing higher. We are at 700,000-tons at the moment, while prices remain high. This means that at any minute we could see a violent change and prices could fall,” he warned. Gonzalez noted that Chile’s state-run Codelco, the world’s top miner of copper, had just reached a record-high output of over 1.7-million tons in 2009.
 Gonzalez’s crystal ball had the benefit of pure luck. Two-days later, the People’s Bank of China (PBoC) shocked the world markets, by suddenly shifting gears to “Quantitative Tightening (QT), or hiking bank reserve ratios a quarter-point to 16%, effectively draining 300-billion yuan out of the Shanghai money markets. The PBoC’s shift to QT was prompted by a surge in bank lending that was flooding the economy with yuan, inflating a bubble in real estate, and risking a surge in inflation.
The Jan 13th hike in bank reserve ratios was the first of three PBoC tightening moves that eventually lifted the ratio to 17% on May 3rd. The copper market remained defiant however, in January, February and March. Copper flexed its muscles for one last fling to $8,025 /tons on April 12th. China’s economy was booming at a 12% annualized clip, and few traders could conceive of a bearish reason to sell the red-metal, beyond the inclination to grab profits.
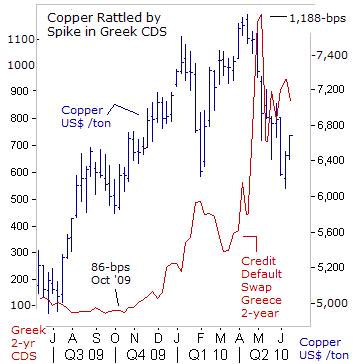
“A trend in motion will stay in motion, until some major outside force, knocks it off its course.” Finally, King Copper tumbled more than 20% in a span of two months, - its biggest sustained loss since the height of the global financial crisis in late 2008, after receiving a powerful jolt from a thinly traded market linked to Greek bonds, called credit default swaps (CDS), - largely absent from traders’ radar screens.
Traders in the volatile CDS markets had exposed the truth about Greece, - that it’s technically insolvent, and can’t repay its €300-billion of debt, without a bailout. When S&P downgraded Greece’s bonds by three-notches to BB+, or junk status on April 27th, Greek bond 2-year yields soared to 26-percent. The copper market began to crumble in a knee-jerk reaction. European banks hold $272-billion in Greek public and private debt, and the extreme volatility in the Greek bond and CDS markets sent a signal to copper traders that it was time to “sell now, and ask questions later.”
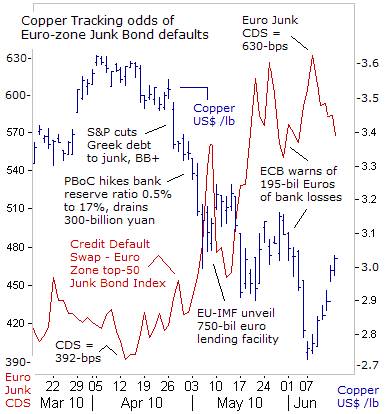
The EU’s equivalent of “shock and awe” – a €750-billion rescue package of standby funds and loan guarantees, for heavily indebted Euro-zone governments that can’t raise funds cheaply in the capital markets, - enabled the Euro-zone banks to survive another near death experience. Still, on May 31st, the ECB warned that Euro-zone banks would face a new wave of potential loan losses - up to €195-billion over the next 18-months, from loans extended to the private sector, that are going sour.
Thus, although the specter of a Greek bond default is postponed for a later date, another lethal phase of the European debt crisis began to erupt, - a frightful situation where European banks become unwilling to lend money to the private sector. There were latent fears of a Euro-zone “credit crunch,” looming on the horizon that could suffocate the $14-trillion Euro-zone economy, and in turn, weaken the demand for industrial commodities, including copper and other base metals.
Euro-zone banks are hoarding a record amount of cash, and buying German, French, and Swiss government bonds, and Gold, rather than lending Euros to the private sector. As liquidity dries-up, the credit default swap for the Euro-zone’s top-50 junk bond index, of lesser credit worthy companies, became a key benchmark for measuring the risk of a “credit crunch.” Each upward surge in Euro-zone junk bond CDS rates ignited a knee-jerk sell-off in the copper market. Conversely, each decline in CDS junk bond rates has given a boost to the red-metal.
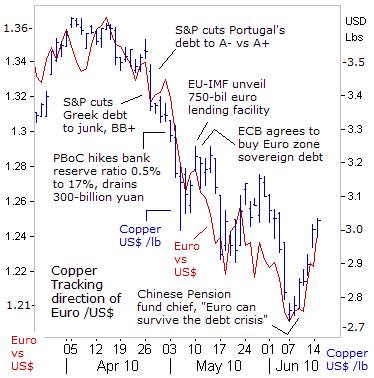 The Euro’s slide against the US-dollar to a four-year low at $1.1850 also began to exert downward pressure on the copper market. The European Central Bank (ECB) has vowed to print vast quantities of Euros, in order to monetize the debt of financially weaker Euro-zone governments. The ECB’s lack of clarity over the size of its printing operations left the Euro vulnerable to speculative attack, and a loss of confidence among central banks, that hold more than $2-trillion of the currency.
However, in the aftermath of copper’s 20% slide from its recent highs, to as low as $2.75 /pound in New York, bargain hunters and contrarians, began to wade into the long-side of the market, betting on a rebound for copper, on ideas that the Euro would ultimately stabilize above the psychological $1.20-level. In the commodity and currency markets, trader sentiment is fickle and can turn on a dime.
Fears that Beijing was dumping Euro from its $2.25-trillion FX stash were alleviated on June 10th, when Dai Xianglong, manager of the China’s National Security Fund said, “I think it is quite normal for the Euro to be experiencing swings because of the European debt crisis. However, I do believe the Euro will gradually stabilize and survive the crisis.” Within minutes, Dai’s soothing remarks lifted the Euro towards $1.2100, and in turn, the copper market hit bottom at $2.75 /pound.
Over-extended short sellers in the Euro began to panic, after Dai indicated he was more concerned about a slide in the value of the US-dollar. “The US fiscal deficit is still big, so there is a risk that the value of China’s forex assets will contract," Dai warned. Nowadays, currency fluctuations are used as an excuse to make speculative trades in industrial commodities. Along with the Euro’s rebound to $1.2350, the copper market jettisoned 10% higher to $3.02 /lb.
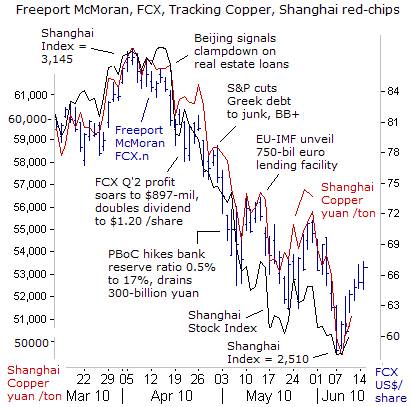 Freeport McMoran Copper & Gold, FCX.N, the world’s largest publicly traded copper miner, tumbled 32% from its highs set in mid-April, closing tracking the slide of the copper and Shanghai red-chips. It was all downhill for FCX, even after posting stellar earnings of $897-million in the first quarter, and doubling its dividend to $1.20 /share. One key catalyst behind FCX’s slide to $57 /share was an announcement by Beijing on April 16th, to clamp down on the property market, by hiking minimum mortgage rates, restricting pre-sales by developers, and tightening controls on purchases of second and third properties.
But suddenly, seven weeks later, on June 8th, speculation of a debilitating “credit crunch” in Europe, and worries about the bursting of a housing bubble in China were touted as overblown. Instead, the speculative appetite for risk was revived, as evidenced by a sharp rebound for the Australian dollar. Highly volatile markets tend to overshoot on the downside and the upside, and markets don’t travel in a straight line. There are zig-zag’s along the way, typical of normal ebb-and-flows of a market.
FCX is a crown jewel among metal miners, and a speculative favorite, because it’s a hybrid between a copper and gold miner. Its fourth-quarter mining costs for copper averaged 62-cents per pound, a big reduction from $1.04 per pound a year earlier. For 2010, FCX expects sales of about 3.8-billion pounds of copper, 1.8-million ounces of gold, and 60-million pounds of molybdenum. Freeport is investing $1.8-billion in its Tenke Fungurume project in the Congo, which is set to produce 250-million pounds of copper and 18-million pounds of cobalt a year.
At-the-end of the day, Copper, the metal with a Ph-D in macro-Economics, is a great place for wagering bets on cyclical swings in the global economy, the whims of G-20 central bankers, gyrations in the US-dollar, and the direction of Shanghai red-chips, all intertwined within a hotbed of speculation.
This article is just the Tip of the Iceberg of what’s available in the Global Money Trends newsletter. Subscribe to the Global Money Trends newsletter, for insightful analysis and predictions of (1) top stock markets around the world, (2) Commodities such as crude oil, copper, gold, silver, and grains, (3) Foreign currencies (4) Libor interest rates and global bond markets (5) Central banker "Jawboning" and Intervention techniques that move markets.
By Gary Dorsch,
Editor, Global Money Trends newsletter
http://www.sirchartsalot.com
GMT filters important news and information into (1) bullet-point, easy to understand analysis, (2) featuring "Inter-Market Technical Analysis" that visually displays the dynamic inter-relationships between foreign currencies, commodities, interest rates and the stock markets from a dozen key countries around the world. Also included are (3) charts of key economic statistics of foreign countries that move markets.
Subscribers can also listen to bi-weekly Audio Broadcasts, with the latest news on global markets, and view our updated model portfolio 2008. To order a subscription to Global Money Trends, click on the hyperlink below, http://www.sirchartsalot.com/newsletters.php or call toll free to order, Sunday thru Thursday, 8 am to 9 pm EST, and on Friday 8 am to 5 pm, at 866-553-1007. Outside the call 561-367-1007.
Mr Dorsch worked on the trading floor of the Chicago Mercantile Exchange for nine years as the chief Financial Futures Analyst for three clearing firms, Oppenheimer Rouse Futures Inc, GH Miller and Company, and a commodity fund at the LNS Financial Group.
As a transactional broker for Charles Schwab's Global Investment Services department, Mr Dorsch handled thousands of customer trades in 45 stock exchanges around the world, including Australia, Canada, Japan, Hong Kong, the Euro zone, London, Toronto, South Africa, Mexico, and New Zealand, and Canadian oil trusts, ADR's and Exchange Traded Funds.
He wrote a weekly newsletter from 2000 thru September 2005 called, "Foreign Currency Trends" for Charles Schwab's Global Investment department, featuring inter-market technical analysis, to understand the dynamic inter-relationships between the foreign exchange, global bond and stock markets, and key industrial commodities.
Copyright © 2005-2010 SirChartsAlot, Inc. All rights reserved.
Disclaimer: SirChartsAlot.com's analysis and insights are based upon data gathered by it from various sources believed to be reliable, complete and accurate. However, no guarantee is made by SirChartsAlot.com as to the reliability, completeness and accuracy of the data so analyzed. SirChartsAlot.com is in the business of gathering information, analyzing it and disseminating the analysis for informational and educational purposes only. SirChartsAlot.com attempts to analyze trends, not make recommendations. All statements and expressions are the opinion of SirChartsAlot.com and are not meant to be investment advice or solicitation or recommendation to establish market positions. Our opinions are subject to change without notice. SirChartsAlot.com strongly advises readers to conduct thorough research relevant to decisions and verify facts from various independent sources.
Gary Dorsch Archive |
© 2005-2022 http://www.MarketOracle.co.uk - The Market Oracle is a FREE Daily Financial Markets Analysis & Forecasting online publication.