


Some Stock Market Technical Signposts
Stock-Markets / Stock Markets 2010 Jun 09, 2010 - 02:30 PM GMTBy: Guy_Lerner

 In this article, I will utilize some daily charts to pinpoint buy and sell points on the ETF's that represent the major indices. These pivot points can be used as road signs to help navigate this hostile market environment.
Figure 1 is a daily chart of the S&P Depository Receipts (symbol: SPY). Key pivot points or areas of most intense buying (support) and selling (resistance) are identified with the black dots. If prices close above this recent pivot at 107.22, then there is a good possibility of higher prices. A stop loss can be placed at 106.04 as this would be the next key pivot formed. (Of note, this has not happened yet but in anticipation of higher prices and a close over 107.22, the next key pivot will be at 106.04, and this would become support.) A close below 106.04 is reason enough to move to the sidelines. For the record, the February low pivot comes in at 106.29, and the November, 2009 low pivot is at 104.05.
Figure 1. SPY/ daily
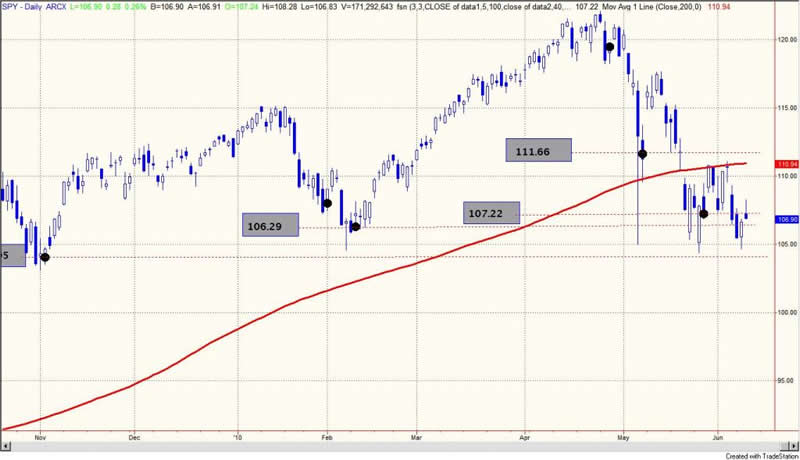
Figure 2 is a daily chart of the PowerShares QQQ Trust (symbol: QQQQ). The breakout last week above 45.70 was a failed signal and the key pivot at 44.32 is the now support/ resistance zone in play. 45.70 is the next level of resistance. A close above 44.32 is reason enough to get long. Although the next pivot has formed yet, it does appear that it should be at 44.17. Therefore, a close below these levels would be reason enough to move to the sidelines.
Figure 2. QQQQ/ daily
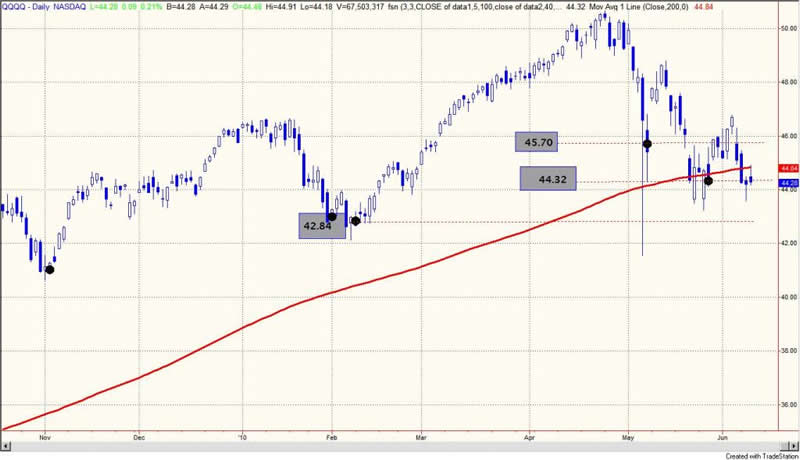
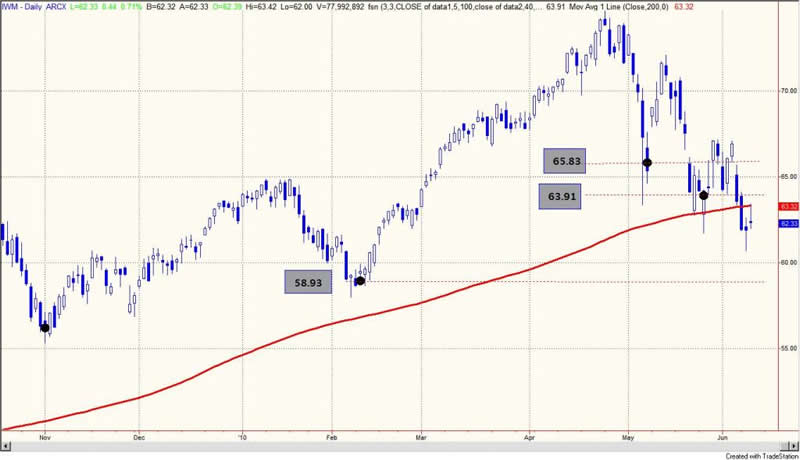
Figure 3 is a daily chart of the i-Shares Russell 2000 Index (symbol: IWM). IWM is well below its 200 day moving average and the most recent key pivot or resistance level (at 63.91). A close above 63.91 would be the signal to go long IWM. The key pivot from the February lows comes in at 58.93.
Figure 3. IWM/ daily
Note: as I write this article (3 pm EST), none of the 3 ETF's are above their key pivots.
By Guy Lerner
http://thetechnicaltakedotcom.blogspot.com/
Guy M. Lerner, MD is the founder of ARL Advisers, LLC and managing partner of ARL Investment Partners, L.P. Dr. Lerner utilizes a research driven approach to determine those factors which lead to sustainable moves in the markets. He has developed many proprietary tools and trading models in his quest to outperform. Over the past four years, Lerner has shared his innovative approach with the readers of RealMoney.com and TheStreet.com as a featured columnist. He has been a regular guest on the Money Man Radio Show, DEX-TV, routinely published in the some of the most widely-read financial publications and has been a marquee speaker at financial seminars around the world.
© 2010 Copyright Guy Lerner - All Rights Reserved
Disclaimer: The above is a matter of opinion provided for general information purposes only and is not intended as investment advice. Information and analysis above are derived from sources and utilising methods believed to be reliable, but we cannot accept responsibility for any losses you may incur as a result of this analysis. Individuals should consult with their personal financial advisors.
Guy Lerner Archive |
© 2005-2022 http://www.MarketOracle.co.uk - The Market Oracle is a FREE Daily Financial Markets Analysis & Forecasting online publication.