UK House Price Trends for 2010 According to the Halifax and Nationwide
Housing-Market / UK Housing Jun 08, 2010 - 01:38 AM GMTBy: Nadeem_Walayat
 Labours debt fuelled economic election bounce is over. The new coalition government is gearing up for deep cuts in an attempt to bridge the huge £156 billion gap between government revenues and spending with already a down payment of £6.2 billion recently announced and at least another £24 billion to come on top of tax rises including raising VAT from 17.5% to 20% to raise at least another £25 billion in new taxes.
UK house prices are stalling after their 10% rally from the depths of the March bear market low as the Nationwide and Halifax start reporting diverging house price data, though both continuing with a bullish twinge.
The Nationwide reports :
The average UK house price rose 0.5% in May to £169,162, to stand 9.5% below the 2007 peak.
Martin Gahbauer, chief economist at Nationwide said “Housing market conditions remain characterised by thin transaction volumes and a relative scarcity of properties for sale, despite a slow return of more sellers in recent months. The current supply-demand balance on the market is still consistent with relatively stable to modestly upward trending prices.”
Britians largest Mortgage provider The Halifax reports :
The Halifax house price index fell by 0.4% for May 2010, up rose 6.9% on an annual basis.
Martin Ellis, Halifax housing market economist: "The mixed pattern of monthly price rises and falls so far this year is consistent with a slowing market and is in line with our view that house prices will be flat during 2010 as a whole."
These are the same financial institutions that were coming out with soft landing mantra during 2007 and 2008 that only succeeded in sleep walking home owners into the worst housing bear market of at least the past 30 years. Readers should always keep in their minds that the mortgage banks have a vested interest in stable to rising house prices as we witnessed with the Halifax which was forced into a shotgun wedding with Lloyds TSB to prevent bankruptcy and nationalisation. Though then the halifax bad debts cancer soon sought to eat Lloyds TSB's balance sheet alive which resulted in a series of tax payer bailouts and loan guarantees to prevent bankruptcy and nationalisation. Therefore house prices trend projections from the Nationwide, Halifax or any other mortgage bank have no real value.
As things stand the UK housing market has entered into the twilight zone of being tugged in two directions, one as a consequence of ZERO interest rates and Bank of England Quantitative Easing aka Money printing so as to INFLATE asset prices such as UK house prices, against which we have severe deficit reduction programme's soon to be implemented that at the very least look set to impact hard those regions of the UK that have very large public sector economies i.e. huge tracts of the North of England, Scotland, Wales and Northern Ireland, with tax hikes to hit house prices nationally, especially as the Buy to Let Sector looks likely to take a hit as a consequence of the doubling of capital gains tax.
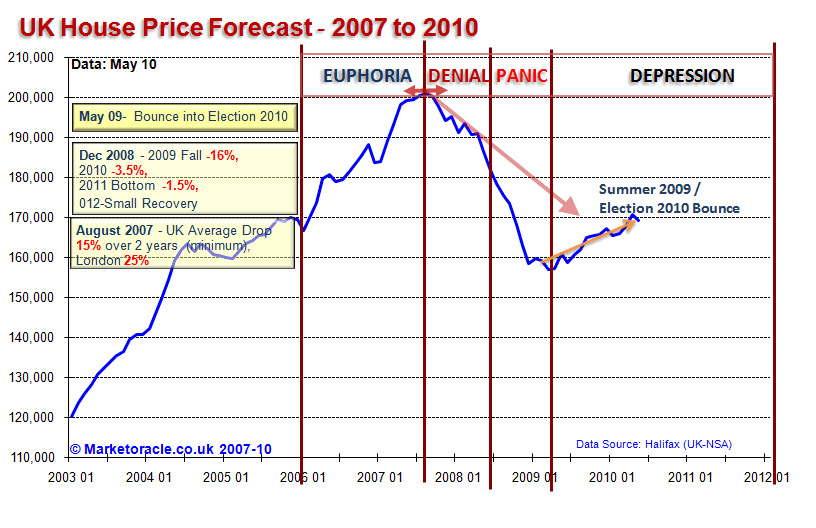
Therefore this series of NEW analysis over the next 6-8 weeks (June/July 2010) will seek to conclude towards a UK house price trend forecast for the next 2-3 years, that will seek to more than replicate the original 2 year bear market forecast of August 2007 made right at the very peak of the UK housing market (22 Aug 2007 - UK Housing Market Crash of 2007 - 2008 and Steps to Protect Your Wealth ), and which builds up on the 100 page Inflation Mega-Trend Ebook of Jan 2010 (Free Download Now), which contained the following UK housing market analysis (graph updated):
UK Housing Bear Market Election Bounce
The UK housing market peaked in August 2007 and entered into a 2 year bear market exactly as forecast at the time (22 Aug 2007 - UK Housing Market Crash of 2007 - 2008 and Steps to Protect Your Wealth ), analysis which projected towards a fall in UK house prices from August 2007 to August 2009 of between 15% and 25% that has subsequently came to pass as UK house prices bottomed in March 2009 after having fallen by 23% from the 2007 peak.
The UK housing bear market has experienced a strong bounce off of the March 2009 lows and now stands up approx 10% off of the low as a consequence of unprecedented measures as mentioned in this ebook, the Labour government has succeeded in temporarily bringing UK house price falls to a halt and triggering an Election Bounce.
The impact of the inflation mega-trend on the UK housing market will be for UK house price to be supported in nominal terms, however this it does NOT ignite the feel good factor that triggers housing market booms which only follow when house prices begin to significantly rise in REAL terms i.e. after inflation.

Whilst the current corrective bounce looks set continue into the middle of 2010 (allowing for a potential one month blip as a consequence of the bad January weather), this rally is still seen as a correction within a housing bear market that is expected to remain in a depression for many years, before house prices succumb to the effect of the inflation mega-trend and start to rise.
Ensure you are subscribed to my always free newsletter to receive weekly and in depth analysis in your email in box (only requirement a valid email address).
Source: http://www.marketoracle.co.uk/Article20120.html
By Nadeem Walayat
Copyright © 2005-10 Marketoracle.co.uk (Market Oracle Ltd). All rights reserved.
 Nadeem Walayat has over 20 years experience of trading derivatives, portfolio management and analysing the financial markets, including one of few who both anticipated and Beat the 1987 Crash. Nadeem's forward looking analysis specialises on UK inflation, economy, interest rates and the housing market and he is the author of the NEW Inflation Mega-Trend ebook that can be downloaded for Free. Nadeem is the Editor of The Market Oracle, a FREE Daily Financial Markets Analysis & Forecasting online publication. We present in-depth analysis from over 500 experienced analysts on a range of views of the probable direction of the financial markets. Thus enabling our readers to arrive at an informed opinion on future market direction. http://www.marketoracle.co.uk
Disclaimer: The above is a matter of opinion provided for general information purposes only and is not intended as investment advice. Information and analysis above are derived from sources and utilising methods believed to be reliable, but we cannot accept responsibility for any trading losses you may incur as a result of this analysis. Individuals should consult with their personal financial advisors before engaging in any trading activities.
Nadeem Walayat Archive |
© 2005-2022 http://www.MarketOracle.co.uk - The Market Oracle is a FREE Daily Financial Markets Analysis & Forecasting online publication.


