


Time Frame Dominance: Why I Stayed Short on Stocks
Stock-Markets / Stock Index Trading Jun 06, 2010 - 06:31 AM GMTBy: JD_Rosendahl

 A reader asked recently, "Why I was staying short with a couple positions when I thought the stock market could bounce and I was discussing a little inverse H&S pattern?" Excellent question.
If you’ve been reading my recent TA of the market, then you know I’ve highlighted a potential inverse head and shoulders pattern. You also know I've repeatedly stated, "I had no long side positions AND was holding a couple of short positions from a week ago, and waiting for a better low risk set up to make new trades." The follow up question has to be why?
There were two slight differences in the recent TA that was speaking volumes suggesting the recent inverse H&S pattern might fail.
First, let’s look at the Jan-Feb bottom of 2010, and its inverse H&S pattern compared to the potential pattern highlighted during last week. Below is the daily chart of the DOW, and you’ll notice a very different MACD relationship to the price patterns.
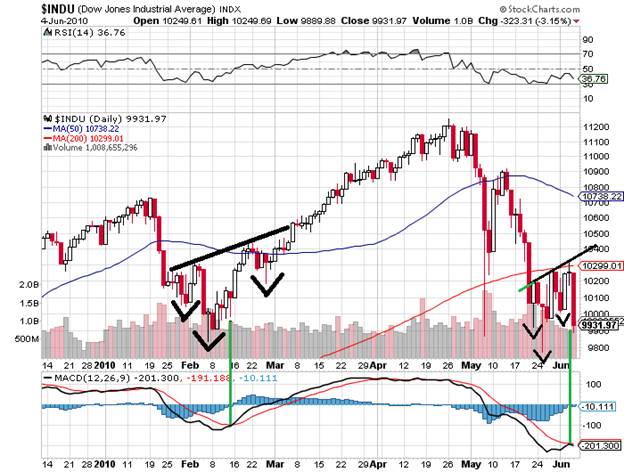
Here's What I like about the inverse H & S in February 2010:
1) Nice full pattern.
2) Dragon Fly Doji Bottom.
3) MACD turns up prior to right shoulder.
4) Right shoulder is a hammer.
Here's what I don't like about the possible inverse H & S of the past week (even though we had a big hammer tail bottom):
1) Small time frame (fragile) price pattern.
2) As the market came out of the right shoulder it failed at the neckline and the 200 day MA with a Doji on Thursday
3) And, the MACD was failing to turn up.
Like I said Thursday, "There's no rule stating we have to or should trade every pattern." In fact, some of the best trades are those we don't make.
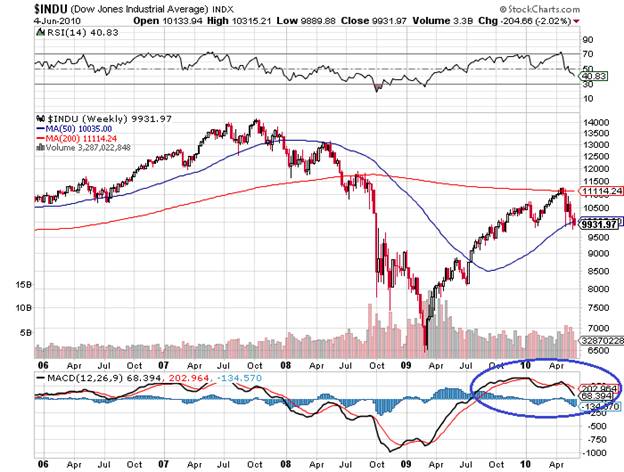
Secondly, take a look at the weekly chart below. You notice the DOW had a bearish divergence going and trending lower on the weekly MACD. I find it hard to get excited about daily price patterns when the weekly MACD is trending against that pattern. I call it "Time Frame Dominance.” The easier way to think about it is sailing with or against the wind. I use it on multiple time frame comparisons. It’s why you see so many short term traders getting bull dozed when trading the 15, 30, 60 minute chart when the daily or weekly MACD is trending against it.
I maintained a few shorts from a week ago because the market the past several days was really in no man's land, and could go either direction. As a frequent trader, I like to look for easier trades, and the setups were not that easy last week, so I was staying inactive and made no new trades until Friday. We added to two short positions, with charts that looked interesting enough.
Below is the daily chart of MCK. Note: This is a very strong and well run company, and usually not the type of company I like to short, NOR am I recommending that for anyone now. But the pattern is a useful tool to reflect the kind of pattern I’m looking for in a trade on the short side.
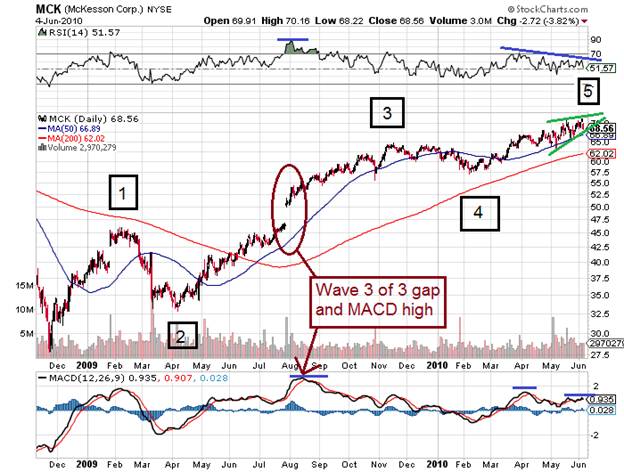
This chart has a lot of interesting things I like as a short candidate:
1) Looks like 5 waves up.
2) Wave 5 is an overlapping move higher, which has the reflection of some kind of triangle.
3) The top of the last three days looks like an Evening Star Candlestick pattern.
4) And, the daily MACD and RSI have bearish divergences forming.
I like when I have multiple indicators suggesting a trade is warranted, it’s always been my experience that it increases the chances of being correct. The triangle suggests a price of $57.50, and if we fill the wave 3 of 3 gap its $46. A break below the triangle is good confirmation, which has yet to happen.
The other stock we added to our short positions is DAL, see chart below. Again, I’m not recommending anyone short this security, but once again it highlights the kind of TA I use when trading.
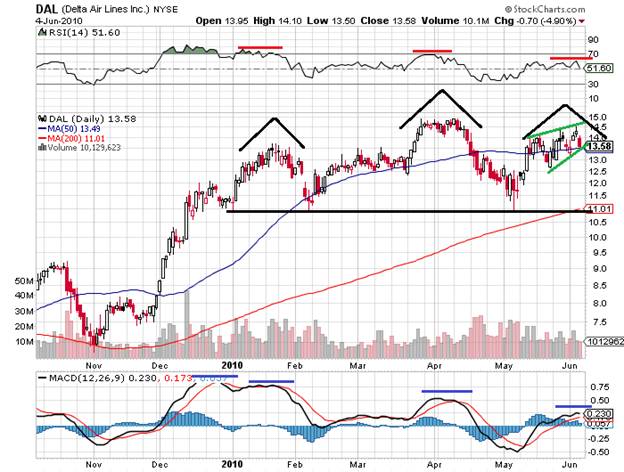
Here's what I like about this chart:
1) Potential H&S topping pattern.
2) The right shoulder has a small over lapping triangle pattern.
3) Another Evening Star the past 3 days.
4) And again, very nice bearish divergences forming on the MACD and RSI on the daily chart.
I don't mind trading the right shoulder when other indicators provide preliminary confirmation to the pattern. An additional thought is the risk reward equation. The stock is trading at $13.54, and the previous high should act as resistance initially, which is $15, and the alternative bullish structure is a move to $18 to complete a broadening top.
If the stock is ready to move lower and it’s not an H&S, it could still move down to the neckline around $11, just to fool everyone that it's a H&S pattern. That’s roughly a 20% gain. If it's a H&S pattern the target is $7, which is a sizeable gain versus the anticipated risk of a move higher to $15. I like this set up for multiple reasons.
NOTE: I'm by no means recommending shorting stocks or the market, or these individual stocks. But merely, demonstrating my TA for entering a trade, which happens to be short side trading.
I feel shorting stocks is inappropriate for many individual investors. However, if you’ve read my TA this year, you would have read at the January and April tops, it was time to put in place gain protection strategies, and take some chips off the table. The market is trading below the January 2010 top confirming that TA was indeed the right call.
Furthermore, even if the stock market found some way to make one more new high, it’s probably the last one for many years to come. If you're an individual investor and still long this market, it’s my belief that you should be putting your chips in a very safe place. The TA I use suggested trading short on the last two market tops, which also confirms investors move money out of the market.
If you’re inclined to trade or short, I highly recommend you have an understanding of your mental and emotional make up and whether or not it’s suitable for trading or shorting, AND that you've developed workable TA that supports trading prior to actually trading live with your own money. It’s just not worth the brain damage to pay for your tutorial in trading with trading losses.
From My Trading Desk:
We added to two of our shorts Friday, and frankly, our positions are not large, as we manage risk additionally by position sizing trades, so no one trade (hopefully) can rack up significant losses when were wrong, then it’s really a numbers game of being right more often than wrong, which I’ve been very good at.
Here’s the way I’m looking at the market after Friday’s selloff. If the top in April is the Elliott Wave 2 or B that we’ve all seen a lot of in blogs, then it has to be wave 3 or C down. That's an easy Elliott Wave concept.
That’s the wave traders want to be trading because the moves are grand and fast. If this is the case, here’s one thing you will see happen as confirmation: "Gaps Down." Waves 3 or C are powerful moves, and move quickly, and it’s typically the wave you see multiple gaps. That’s one of the little things I’m looking for. You’ll also hear it referred to as flash crashes because of the wave cycle we're discussing.
If the market opens and trades higher with no wash out of Friday's low, I doubt that is the bottom of any type for this leg down because typically after a large sell off like Friday, we should expect a lower opening followed by a rally intraday. If the markets open and trade higher creating an inside day, that’s not going to scare me off my trading shorts, and I’ll hold.
If we get the gap down open, I will take a short or two off because I’m trading the short side, and I want some cash to re-enter counter trend bounces, but I also want to hold a couple shorts because this could be wave 3 or C.
Here’s my immediate down side analysis: The markets have yet to put in any form of down side bottom structure, and nothing on the daily chart looks remotely bullish other than a potential reverse of the daily MACD in the near term. The daily Bollinger Bands have started to re-widen with Fridays drop. If we gap lower Monday or Tuesday, I expect price to move down to the lower band, which is DOW 9,750, Ironically, the weekly Bollinger Band is the same price. The short term support area includes prior lows, and the lower daily and weekly Bollinger Bands, and the 50 weekly MA. The support zone I’ve been discussing is 9,700-9,900, and we may see a deeper push into that zone soon.
After that, the entire move higher from March 2009 has a Fibonacci 38.2% retracement support at about 9,500ish.
That’s my trading view on the market and my plan, I have shorts going on 4 stocks and one real estate index. I like all patterns so far, and now it’s really active management. We have to be flexible enough to not be married to positions should the TA suggest something else, nor be married to something offering a solid gain that should be taken off the table.
I also understand, "That in a market like this, we are going to get wild days. Strong sell offs and panic buying days. Patterns will fail, and market price action will not be for the faint of heart."
Hope all is well.
By J.D. Rosendahl
www.roseysoutlook.blogspot.com
J.D. Rosendahl was a former stock broker/investment consultant (currently not licensed) before becoming a Commercial Banker for the past 14 years. He manages his family's wealth, helping them avoid the high tech bubble and the real estate bubble melt downs and preserving wealth.
© 2010 Copyright J.D. Rosendahl - All Rights Reserved
Disclaimer: The above is a matter of opinion provided for general information purposes only and is not intended as investment advice. Information and analysis above are derived from sources and utilising methods believed to be reliable, but we cannot accept responsibility for any losses you may incur as a result of this analysis. Individuals should consult with their personal financial advisors.
© 2005-2022 http://www.MarketOracle.co.uk - The Market Oracle is a FREE Daily Financial Markets Analysis & Forecasting online publication.