Silver's Subtle Bearish Signals for Commodities
Commodities / Gold & Silver Sep 03, 2007 - 09:56 PM GMTBy: Brian_Bloom
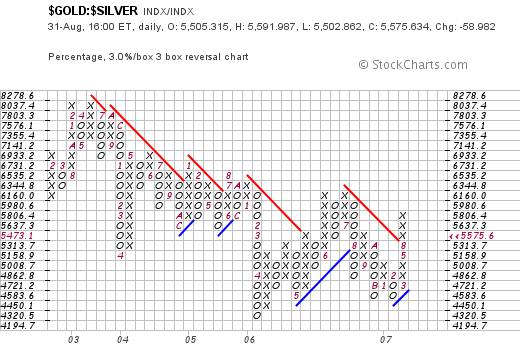
 Below is a Relative Strength Chart of Gold:Silver.
A 3% X 3 box reversal scale has been chosen to eliminate trading noise.
What the chart shows is that, by and large, gold has been under performing silver since 2003, but that this relative under performance may have bottomed.
(courtesy sharpcharts.com)
Looking closer at the 50 point X 3 box reversal chart below, we see an interesting “W” (double bottom) formation which seems to have acted as a launching pad for gold to rise relative to silver.
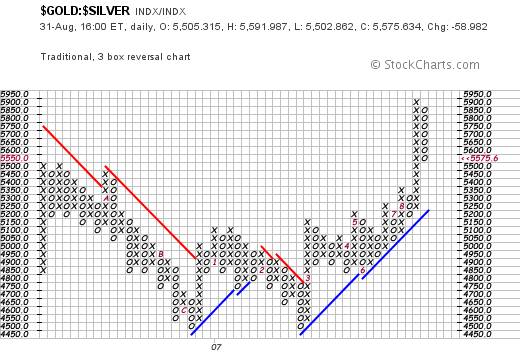
Of significance, is that when the 5500 resistance level was penetrated to the upside, the chart rocketed upwards to a new high. However, in the process, a “high pole” was formed, and the latest pullback of the ratio has retraced more than 50% of the rise – implying that the ratio might be expected to pull all the way back to the 5500 level.
What might this mean? Does it mean that gold is outperforming silver, or does it mean that silver is under performing gold?
A recent article by Scott Wright which can be found at http://www.gold-eagle.com/gold_digest_05/wright083107.html would suggest that the answer might be primarily related to the relative under performance of silver.
Indeed, it was this latter article which prompted me to look at the above charts.
From this analyst's perspective, the relative under performance of silver might be sending us a subtle message that the era of speculation in precious metals might be drawing to a close.
Richard Russell has been calling for a third up leg in the Dow Jones given that no bull market ever ends in a whimper. That would imply an era of asset hyperinflation. I have the deepest respect for Richard. Indeed, his writings together with those of Harry Schultz, Joe Granville and The Bank Credit Analyst pointed me in the direction of technical analysis around 35 years ago.
However, I find myself unable to agree with his prognosis this time around. I cannot imagine a public – which is already drowning in debt – borrowing yet more money against hyperinflationary growing values of their homes in order to throw money at the stock market. (They would have to do his given the currently negative savings rate). The public would also have to ignore the high profile messages being beamed into the markets by the sub-prime mortgage markets given that these borrowings would still need to be serviced. All this assumes a stupidity of the average person which I just can't accept. I also cannot accept that the Board of Directors of the United States Federal Reserve is collectively sufficiently stupid that it cannot grasp the likely consequences of printing unlimited amounts of money. Nowadays, economists are not as ignorant as they once were. Of course, everyone is prone to errors in judgment, but an error of this magnitude? I just can't buy into such an argument.
Why raise this issue at this time?
The reason is that in the 1980s I wrote and self published a book on the stock market which used Richard's same “third leg” logic as applied to the Gold Price. I was expecting the gold price to break above its then peak of $850 because the charts then were showing only two up-legs. In terms of Dow Theory (and Elliot Wave Theory) there should have been a Third Up-leg in the Gold Price at that time.
I was wrong. It never materialized. Elliott Wave Theory, whilst compelling in its logic, is not infallible.
So, if the charts are pointing to a $1,400 price of gold per ounce, and the speculative hysteria is going out of the markets, then which statement (if either one) is incorrect? Surely they both cannot be correct?
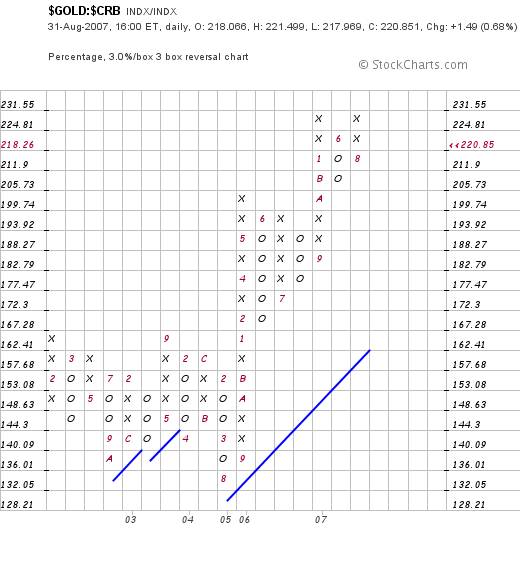
The 3% X 3 box reversal relative strength chart of Gold:Commodities shows Gold in a strong bull market relative to commodities.
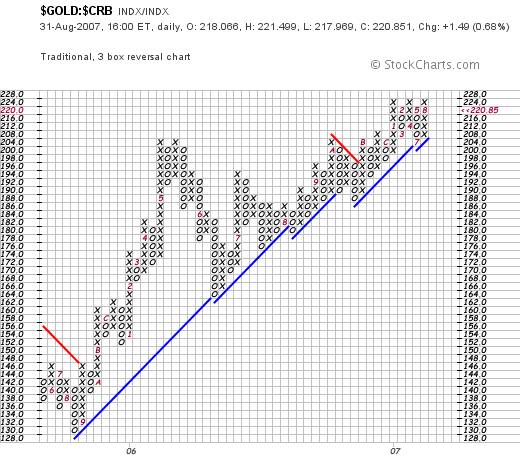
Looking more closely at the more sensitive 4 point X 3 box reversal chart below, this bull market can be seen more clearly
The Gold:Silver relationship above got me thinking. What if the Gold:Commodities chart has been rising because commodities have been weakening?
Frankly, the 3% X 3 box reversal chart of commodities below is not a happy looking chart
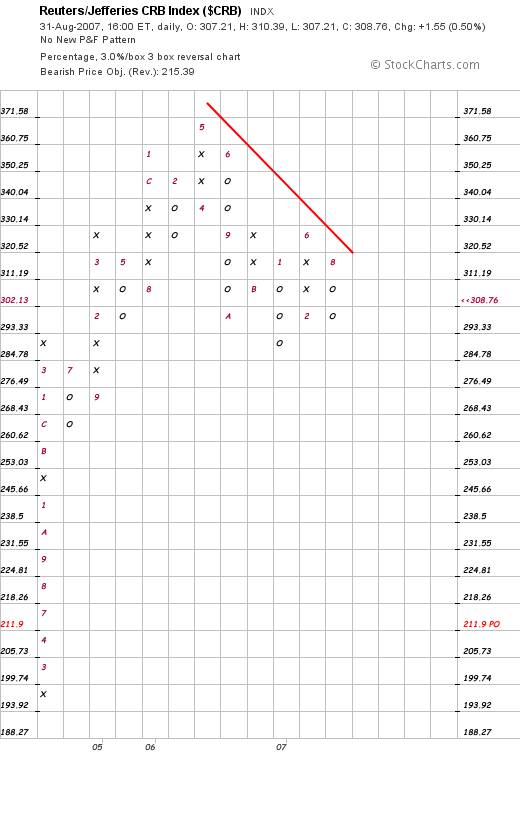
Indeed, if this chart were to break down, a target price objective of 211.90 is on the cards. That's a 32% fall.
The more sensitive chart below is not looking particularly bullish. Arguably, it is manifesting a diamond formation which many people believe is exclusively a reversal pattern. In my view a diamond pattern – like many others – is a sign of a market in a state of indecision.
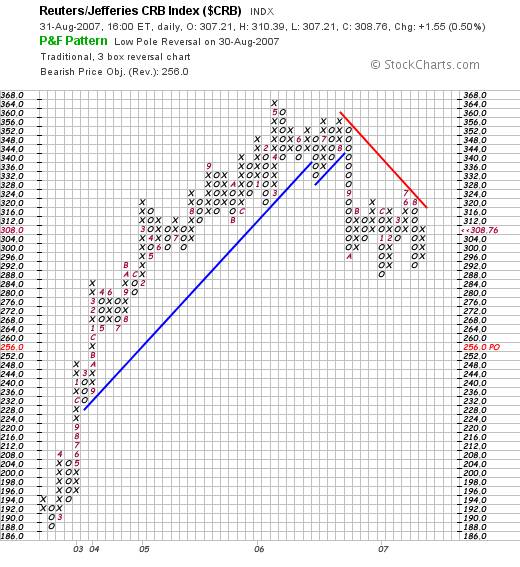
To this analyst, in the context of the overall picture of the chart above, this diamond pattern is more likely to break down than up.
If it does, the price target of 256 will cause a breakdown in the less sensitive chart above.
Interestingly, the chart below shows silver in a bull trend relative to commodities, and silver seems to be bouncing up.
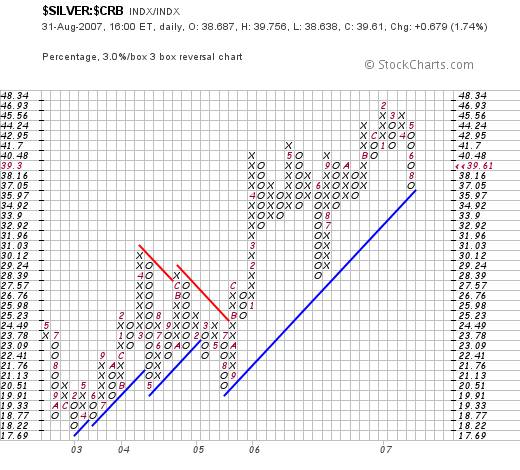
So, the bottom line is that Commodities in general are weakening relative to silver which, in turn, is weakening relative to gold, whilst gold (for the time being) is refusing to rise to new heights.
All of which brings me back to one of the two charts which have been giving me the clearest guidance over the past couple of years.
The weekly Goldollar Index chart below (courtesy Decisionpoint.com) is telling me (so far) that the US Dollar is not going to collapse
![]()


If the US Dollar does not collapse, an implication is that “neither will the US economy”.
Conclusion
In context of the fact that both silver and gold – apart from being precious metals – are also “new age” raw materials, the strength of their prices – in particular that of silver – relative to commodities may be sending out a subtle message.
Based on other information which has been the subject of research by this analyst for several years, a conclusion might be drawn that the Industrial Markets may mark time from this point as the world economy treads water.
This writer is of the view that there are fundamental reasons why gold will – eventually – reach $1,400 an ounce, but that these reasons have nothing to do with gold as a currency. Also, the P&F chart which is pointing to a target of $1,400 is not time sensitive. Gold might take years to get to that price.
This analyst is convinced that gold became a precious metal in the first place because it has unique physical properties which, in the fullness of time, will add a new dimension to human evolution.
It is my conclusion ( which I will be the first to amend if the markets start sending different signals ) that the world economy may be entering a period of consolidation pending the emergence of new (wealth driving) energy technologies which are waiting in the wings. Technically, this consolidation might last upwards of one to two decades.
By Brian Bloom
www.beyondneanderthal.com
Since 1987, when Brian Bloom became involved in the Venture Capital Industry, he has been constantly on the lookout for alternative energy technologies to replace fossil fuels. He has recently completed the manuscript of a novel entitled Beyond Neanderthal which he is targeting to publish within six to nine months.
The novel has been drafted on three levels: As a vehicle for communication it tells the light hearted, romantic story of four heroes in search of alternative energy technologies which can fully replace Neanderthal Fire. On that level, its storyline and language have been crafted to be understood and enjoyed by everyone with a high school education. The second level of the novel explores the intricacies of the processes involved and stimulates thinking about their development. None of the three new energy technologies which it introduces is yet on commercial radar. Gold, the element , (Au) will power one of them. On the third level, it examines why these technologies have not yet been commercialized. The answer: We've got our priorities wrong.
Beyond Neanderthal also provides a roughly quantified strategic plan to commercialise at least two of these technologies within a decade – across the planet. In context of our incorrect priorities, this cannot be achieved by Private Enterprise. Tragically, Governments will not act unless there is pressure from voters. It is therefore necessary to generate a juggernaut tidal wave of that pressure. The cost will be ‘peppercorn' relative to what is being currently considered by some Governments. Together, these three technologies have the power to lift humanity to a new level of evolution. Within a decade, Carbon emissions will plummet but, as you will discover, they are an irrelevancy. Please register your interest to acquire a copy of this novel at www.beyondneanderthal.com . Please also inform all your friends and associates. The more people who read the novel, the greater will be the pressure for Governments to act.
Brian Bloom Archive |
© 2005-2022 http://www.MarketOracle.co.uk - The Market Oracle is a FREE Daily Financial Markets Analysis & Forecasting online publication.


