


Stock Market Update: Ghost of Crashes Past
Stock-Markets / US Stock Markets Sep 02, 2007 - 09:23 PM GMTBy: Dominick

This week brought back memories of when I would post at different boards on the web where no one wanted anything to do with a bullish chart that ultimately, if they'd listened, would have saved them tens of thousands of dollars. It was the October 2005 low, everyone in the world of Elliott wave was predicting a crash, and I just had to leave that suffocating, doom and gloom atmosphere. Because of that, TTC was formed.
Even within a community of unbiased traders, it's hard to avoid not seeing these bearish, end-of-the-world market calls, as it seems people go out of their way to get them in front of a trader. You see them in the News, CNBC, websites, forums, and in all that spam mail. Year after year we go through the same thing, but no collapse. I bet it feels good to predict a stock market crash and sell the exact top tick, but I bet it feels better to consistently make money week in and week out, up and down, without worrying about a crash – especially if there isn't one! Still, it seems a lot of traders out there, and most analysts, want to hit the grand slam – they quickly give in to extremely bearish sentiment, call it “the ghost of crashes past”, and rather than simply trading what the market gives, project this bias onto their charts.
Since its inception, TTC has caught every directional move including the one we're in now. A bit of deserved bragging? Maybe. As analogs of 1987 circulate, the anniversary of 9/11 draws near, and the ominous months of September and October loom ahead, fears of a major market crash continue to be a factor in the minds of many, and the foundation for short covering rallies like we saw at the end of this week. In contrast, I think I can fairly say I was the only analyst early in the week expecting a bullish close. Here's the chart posted to members Tuesday morning before the opening:
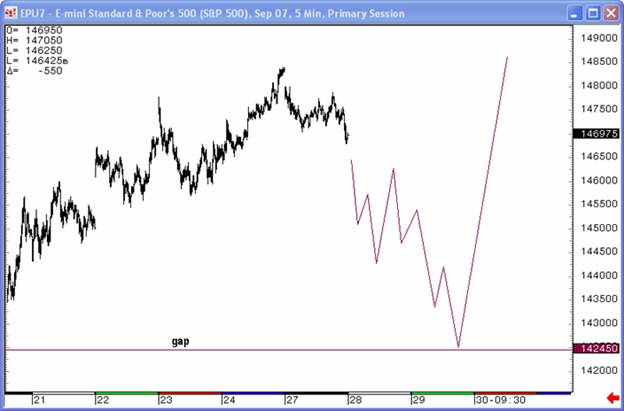
Some of the newest members at TTC have expressed concern that we don't make specific market calls, that we don't tell you specifically what to buy and sell. Every trader has their own risk tolerance and time frame, so it makes sense to let each make their own decision about how to trade. As our name suggests, we provide charts, market structure analysis, market levels that are precisely hit, and proprietary tools that help traders formulate their own positions. We teach you how to fish. But, though we don't hold people's hand, the chart above shows that anyone coming into this week looking for a 1300 or a 1200 or an 1100 print on the S&P, as some undoubtedly were, they weren't going to be able to make much money – at least they weren't going to be able to keep it. I pounded the table all week saying that we weren't going to crash, but this one chart alone should have dispelled those ghosts of crashes past for TTC members.
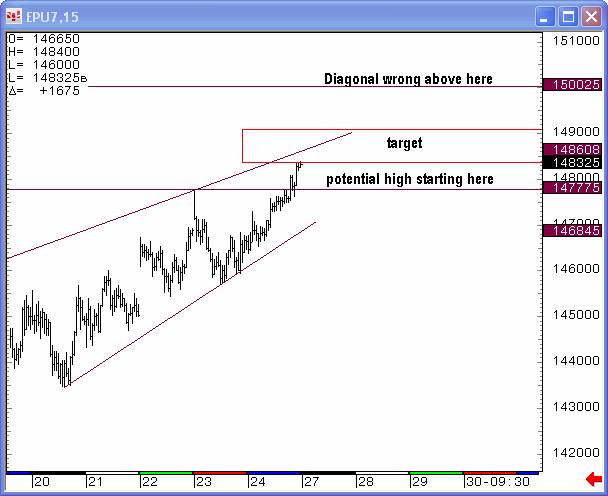
Remember the last update left off with an ending diagonal, shown below, suggesting the termination of the rally from 1375 and a sharp move to the downside ahead. The lower band of the target had already been hit as of Friday's close, but, in typical unbiased fashion, we went into the weekend flat and allowed Monday's price action to give us the direction for the next trade rather than taking a guess.
When Monday opened with a gap down, the decision was made for us, and, some intra-day scalping around our old numbers and trendlines aside, we saw that day as the beginning of a decline that would ultimately be worth 50 points. The first chart above, again, posted on Tuesday before the opening bell, had a preliminary target of 1424.50, a V-bottom before a sharp rally to close the week. Here's how that chart looks as of Friday:
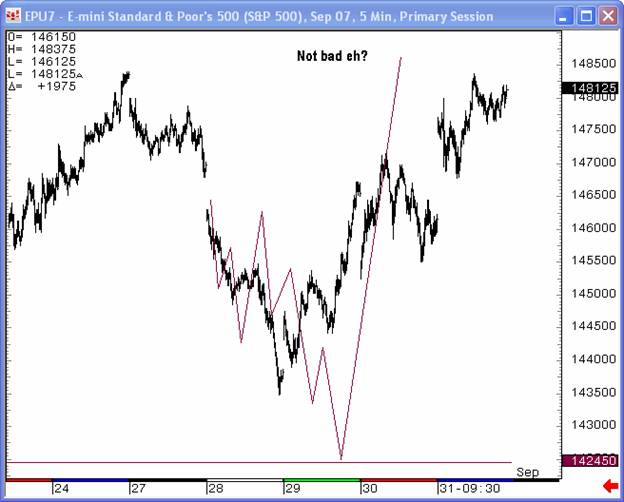
Obviously, the selloff did not reach my exact target, but I nevertheless expressed interest in taking a long position in advance of Tuesday's close, something that must have shocked any members somehow still under the influence of a bearish bias or clinging to their crash theses. The accelerated development of the move suggested the selling was becoming overdone, and the clear five waves down suggested a completed pattern, so the bullish idea was more than just a stab in the dark, more than just catching a falling knife. That doesn't mean I didn't use a stop to prevent this somewhat bold trade from developing into a serious loss if wrong. As it happened, I personally closed out my long position at a profit in the overnight trading and suggested others do the same, or take advantage of Wednesday's beautiful gap up open to start the day fresh again. And, despite choppy action Wednesday morning, the general direction of the trade off this perfect V-bottom was clearly upward.
I don't think I can stress enough that TTC expected and got a V-bottom in a week that many feared could be the start of a major decline of a few hundred points, if not an outright crash. Even though we were trading to the downside from Monday morning, there was never the expectation of anything like an '87 collapse suggested by my charts, not without getting levels well below my 1424 target. The result was that while some were predicting the collapse of the entire banking industry we were buying bottoms!
The move up from Tuesday's low continued to be choppy, but we stuck with our tried and true numbers. Readers will notice that one of the most important and useful facets of our target levels is that they are not one-time deals, but persist week after week as make-or-break levels that repeatedly form inflection points either up or down. Trading the trend away from these levels has been the central theme of our trading for almost two months now, in conjunction with our proprietary indicators and real time chat, since the distortion of high volatility has obscured clear wave structures. This meant that Thursday's close also became a buying opportunity as the market seemed to be fighting for support just below our key level at 1467. As usual, it can be debated whether the news conforms to the charts or whether it's all a big coincidence, but the gap up confirmed our expectations. It's pretty hard to believe that Friday's low being exactly 1467 is only a coincidence, but either way, we used that level to get long again for a more than ten point rally before going flat as the ES went directly into my 1484 target.
In the end, this week's action leaves us in roughly the same place we were a few weeks back, when I said in the August 18 update:
“The overall structure is not as easy to read as it should be because of all the distractions and manipulations, but two very powerful patterns, each moving in opposite directions, are viable from here. The market has spoken last week and the bears have one more chance at this. IF they can't succeed, I'll see you at the year-end rally!”
So far, the warning several weeks ago not to fight the Fed has proved to be excellent advice, helping us avoid the bear-attack at last month's option expiry, and, if anything, Bernanke's speech on Friday moved the central bank closer to an outright cut in the target rate than we've seen so far. Of course, a big part of that is predicated on an increased risk to overall economic growth and, with several major bankers and brokers yet to announce the full extent of their subprime and CDO damage, there could be a lot more pain hitting the tape at some point in the not too distant future.
Tuesday's selloff again set off the crash alarms across the media and internet, but this isn't usually how crashes evolve, so highly publicized and with such negative sentiment. I continue to hear chatter about the PPT, but this is always shorts complaining about their losses and, for the life of me, I can't understand why anyone so convinced the PPT is buying this market would be short! What we can know is that for now at least the threat of the Fed seems to be a limit to the downside and that the advantage shifted to the bulls this week. Members already have access to levels above here that would trigger another massive short squeeze if taken out, and maybe from there, just maybe, we'll have the sort of conditions that would allow a real calamity. In the meantime, the best strategy day to day and week to week is to chase away the ghost of crashes past, throw off the chains of any bias at all, and simply trade the charts! If and when a crash or severe market decline is seen in our work, we will look to be on that trade sooner than anyone else.
Members
Finally, be sure to check out our weekly “road maps” as that's where the real big picture shapes up, where we compile charts of any market that talks to us, ranging from a look at the last few weeks to huge timeframes all the way back to the 1900's.

‘ Non-members
This update is a nice read, but it can't compare to these road maps and all the intraday updates we provide in realtime. Join now for $89 per month! www.tradingthecharts.com
Have a profitable and safe week trading, and remember:
“Unbiased Elliott Wave works!”
By Dominick
For real-time analysis, become a member for only $50
If you've enjoyed this article, signup for Market Updates , our monthly newsletter, and, for more immediate analysis and market reaction, view my work and the charts exchanged between our seasoned traders in TradingtheCharts forum . Continued success has inspired expansion of the “open access to non subscribers” forums, and our Market Advisory members and I have agreed to post our work in these forums periodically. Explore services from Wall Street's best, including Jim Curry, Tim Ords, Glen Neely, Richard Rhodes, Andre Gratian, Bob Carver, Eric Hadik, Chartsedge, Elliott today, Stock Barometer, Harry Boxer, Mike Paulenoff and others. Try them all, subscribe to the ones that suit your style, and accelerate your trading profits! These forums are on the top of the homepage at Trading the Charts. Market analysts are always welcome to contribute to the Forum or newsletter. Email me @ Dominick@tradingthecharts.com if you have any interest.
This update is provided as general information and is not an investment recommendation. TTC accepts no liability whatsoever for any losses resulting from action taken based on the contents of its charts, commentaries, or price data. Securities and commodities markets involve inherent risk and not all positions are suitable for each individual. Check with your licensed financial advisor or broker prior to taking any action.
Dominick Archive |
© 2005-2022 http://www.MarketOracle.co.uk - The Market Oracle is a FREE Daily Financial Markets Analysis & Forecasting online publication.