


Text Book Ending of a Substantial Bear Market Rally
Stock-Markets / Stocks Bear Market May 25, 2010 - 09:25 AM GMTBy: Garry_Abeshouse

 The end of the dream is not the end of the world, even though it may at times seem that way.
If I have learned one thing about financial markets over the last 40 years or so, it’s that large upward price moves often fail to relate to the realities of the real world. A human civilization based upon limitless consumption, fueled by an endless supply of credit in an environment of limited resources cannot go on forever. At some time it must end. In many ways this is really what the GFC is all about. The financial markets meltdown is merely a symptom of the disease – not the disease itself. This should never be forgotten.
What we have experienced since 1982, should probably be seen as the normal result of easy money fueling the “Bush Wars” together with an ever expanding gambling culture among hedge funds and merchant banks.
Even a cursory study of history will uncover a plethora of financial collapses not unlike the GFC we have experienced since 2007.
Wikipedia lists 3 major banking crises in the 18th century, 11 in the 19th century, 11 in the 20th century and 2 so far in the 20th century. It actually divides up the 2007 to 2010 GFC as being made up of 8 individual banking crises – I suppose that’s globalization for you.
What is contained in this list is absolute proof that we collectively never learn from these often painful lessons of history – so as they say, we are left to repeat these same mistakes, again and again and now.
Stock markets were created to assist businesses grow, build, create and distribute of real goods and services with real utility in the real world – not the creation and distribution of gambling chips now known as financial derivatives. Real goods and services needed by real people in the real world should be the “dog” wagging the “financial tail” – not the other way around. The tail does not wag the dog – something must give.
Technical Analysts used to, and should still be accustomed to the truism that “the news always follows the event”. So we should not be surprised at the almost daily revelations that accost our senses from the daily media. And as there is no indication that we have seen the end to this revelation supply, I am sure the markets have a lot more to fall.
One hundred and fifty years of booming financial markets
You could say that in both North America and Australia the disease of massive overconsumption, really took off with the discovery of gold in the mid 19th century. This helped expand the money supply and economic growth in both these countries. The relentless economic growth of the western economies, fuelled by industrialization and constant wars, meant that demand for raw materials was only ever going to go one way – and that was up.
The passing of the Pacific Railway Bill in the 1860’s opened up the North American hinterland to a huge expansion of agriculture and mining, paving the way for a massive expansion of the banking system and propelling the US into a 150 year bull market that probably only recently has seen its highs.
The 1880’s in Australia saw a similar expansion of the state railway systems in Victoria and NSW, leading to massive real estate speculation resulting in a spectacular financial bust in the 1890’s, especially in Victoria (see “The Land Boomers” by Michael Cannon, 1966 – a fascinating read). In 1883 a large silver, lead and zinc deposit was discovered in Broken Hill, setting in motion a mining boom that was to eventually peak with the “Poseidon” nickel speculative boom in January 1970. Successive Australian governments have allowed this country to be pillaged as a major quarry to the rest of the world ever since the early days of this boom.
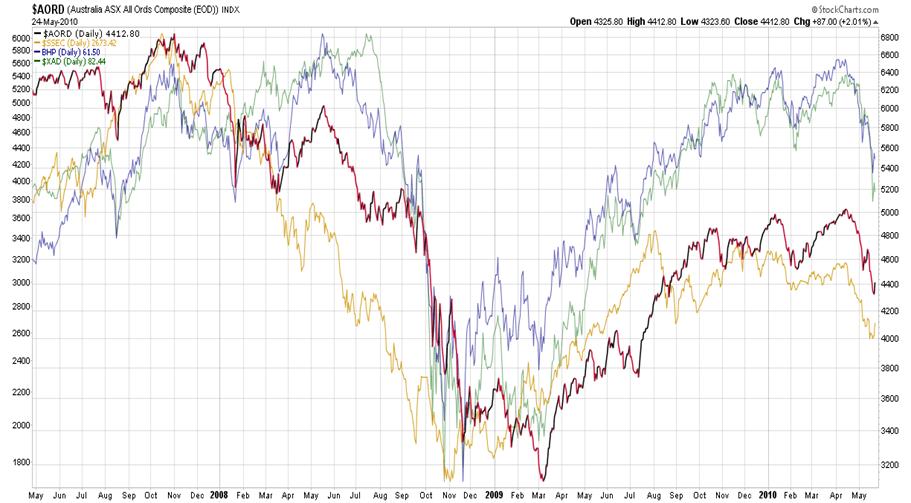
The close relationship between the strength of the Australian economy and commodity prices and mineral importers has continued since then. Hence in 2010, it is no accident that the AUD, BHP, and the Australian stockmarket are often considered as proxies for the outlook on industrial and precious metal prices, in which scenario China plays a large part of future expectations. The charts below illustrate this point well.
On the 3 year daily line chart below you will find the Australian All Ordinaries Index in black/red, BHP in blue, The Australian Dollar in green and the Shanghai Composite Index in yellow.
Previous Posts on this site
If you have read any of the previous posts (the last one was in November 11th 2009) on this site, you will be aware that my long held view was that since early March last year equities have been in an extended bear market rally and that my expectations were that once ended, the bear market proper would resume.
The eventual flight to “safety” would mean that initially the USD would rise to test the 84/85 area and possibly higher and that US T-Bond prices would rise as well.
On May 1st 2010 I sent out a private client newsletter which opened with these words:
“Someone recently said that the USD was the worst currency in the world to buy at the moment – except for all the others. That just about sums up where we are in the markets at the moment. The mud is clearing and the chart patterns have matured to the extent, where it appears that drama in the financial markets, similar but probably worse than the 2008 GFC, is imminent. By imminent this time, I mean some time between now and the end of October, 2010, but most probably over the next few days or weeks rather than months. It is probable that the tipping point for this move has already past.”
Currencies
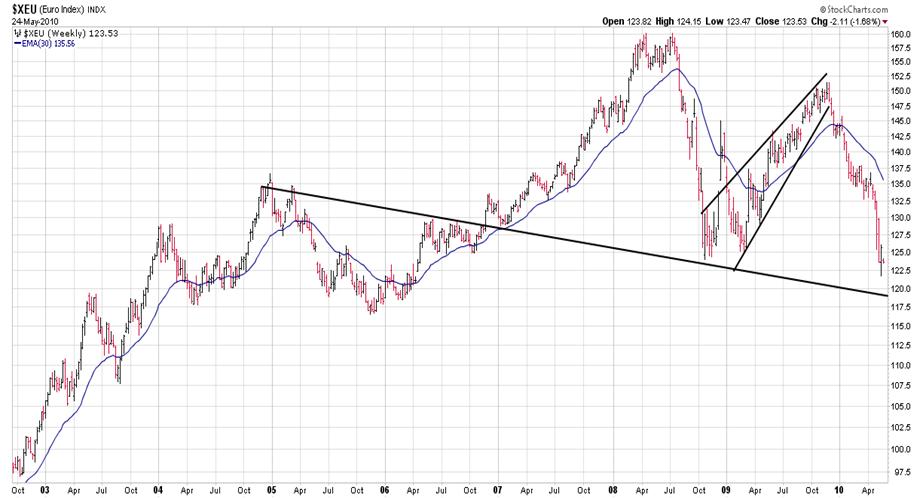
“The euro broke its uptrend in December 2009 in unison with the USD breaking a corresponding downtrend. In retrospect I would say that this event was probably the tipping point for the next stage in the GFC. Note upward wedge patterns, as mentioned in previous newsletters, tend to predominate in bear markets.
The uptrend breaks shown below, from a Technical Analysis point of view, were the first clear signs that the bear market rally in equities would soon come to an end and that a new financial crisis was in the offing. The euro is showing short term signs of support above 1.31, but every attempt to rally from the current consolidation area over the last four weeks, has been quickly stomped upon. As long as local support at 1.31 holds, a rally cannot be ruled out, but this rally is looking increasingly unlikely as time goes on. A stab down below the psychological 1.30 support would herald a continuation of the bear trend with the next target being a testing of the February 2009 lows of 1.24.”
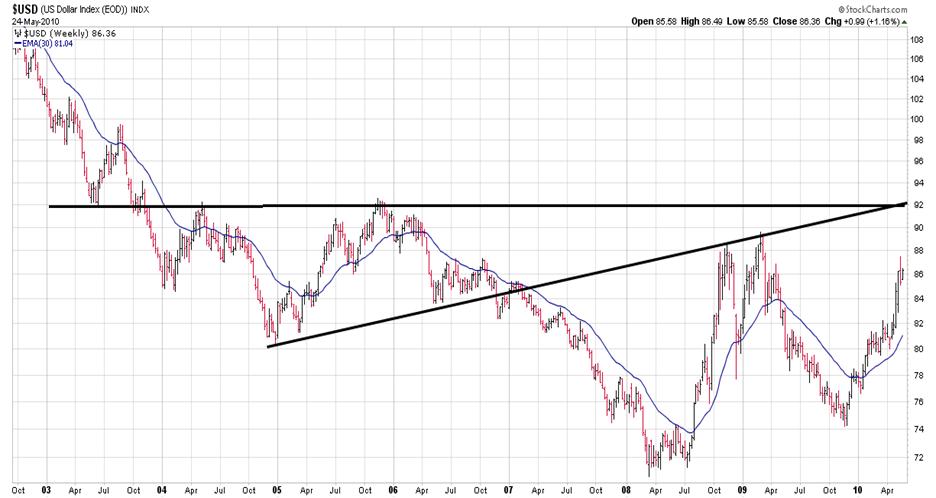
(Any stab below 1.20 may well signify a much longer term bearish transition, which would in turn have major consequences on the upside potential of the USD. As you can see below the 92 level is quite significant.)
“Similarly the USD is still sensitive to a downside price reaction, but constant intraday support during minor price drops appears to indicate solid underlying strength. Comex intraday charts appear to show the USD could be in the final stages of a large base. This would be confirmed by a sharp rise above 83, which would break important resistance lines on both my Comex charts. The size of the base, once confirmed, should probably see an eventual testing of the highs around 90/91, last seen in early March 2009.
The patterns below shown in the charts of the Canadian and Australian Dollars, show potential for weakness rather than future strength, with even smallish falls (eg to below 0.91 for the AUD) confirming the above prognosis. Initial targets of between 81 and 83 for the AUD would then be a probability. As the move down in equities progresses, a testing of the 2009 lows would not be out of the question.
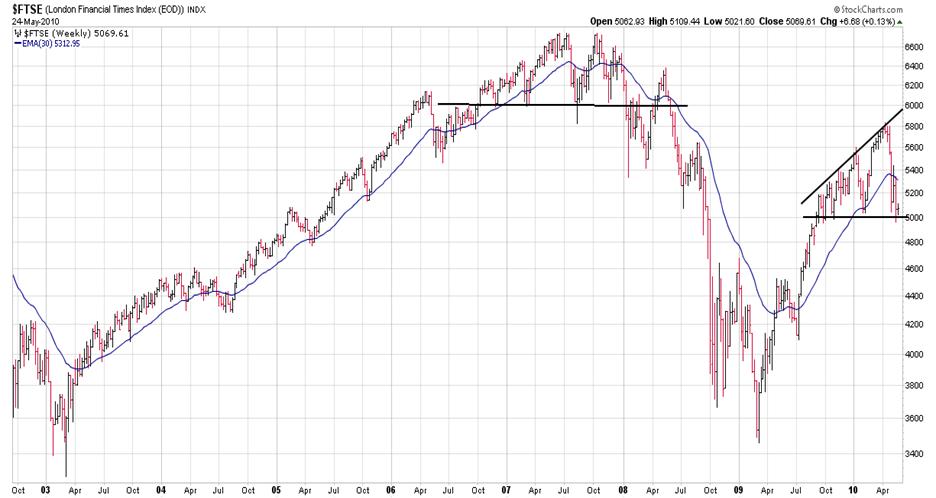
Compared to most of the other currencies, the British Pound has failed to make much headway against the USD over the last 13 months, breaking down from a large top in February, as predicted in earlier commentaries. The current consolidation area above 1.48 is unlikely to hold and a testing of the 2009 lows at 1.36 seems inevitable. This bearish view is underlined by the broadening top in the FTSE as well, illustrated below.”
May 1st commentary continued . . .
Broadening Formations – A brief discussion
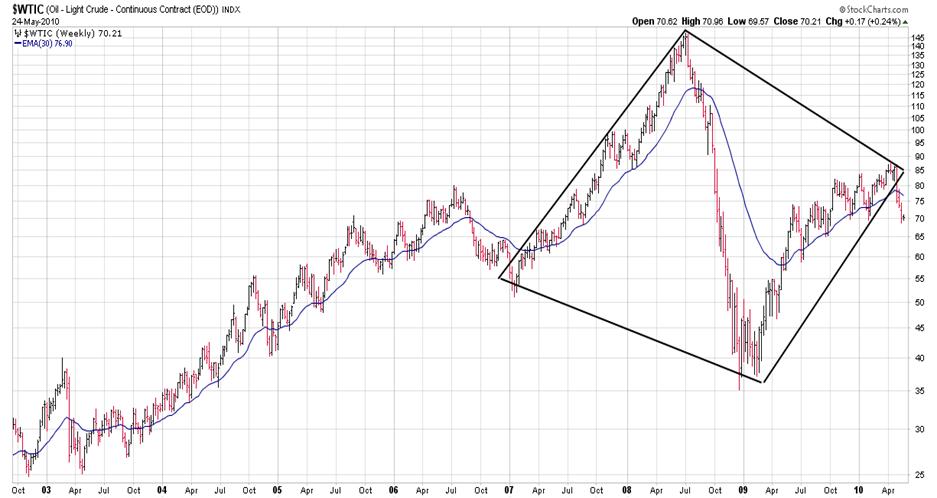
“A small aside on Broadening Chart Formations, of which there will be more examples below. In earlier comments, I have referred to a manual on Technical Analysis by Robert Edwards and John Magee. Their book and their chart examples, relied heavily on their experience in the NYSE between 1928 and 1947, a time when bear markets were in plenty. I know of no one else who had more experience of bear markets and also recorded observations of these events from a charting perspective.” (Note Edwards & Magee also refer to “diamond formations” as per the Crude Oil Weekly chart above as top formations, not unlike and related to the often referred to “Head & Shoulders” tops.)
“Their observations on all types of broadening formations during this time, were that when they appeared at the top of a rise, there was a 90% chance they would end up as significant tops, rather than continuation patterns for a further rise. A similar observation was made about upward wedge patterns. Even if prices briefly went to new highs for both these formations, the bearish prognosis was more likely to prevail not too long afterwards.
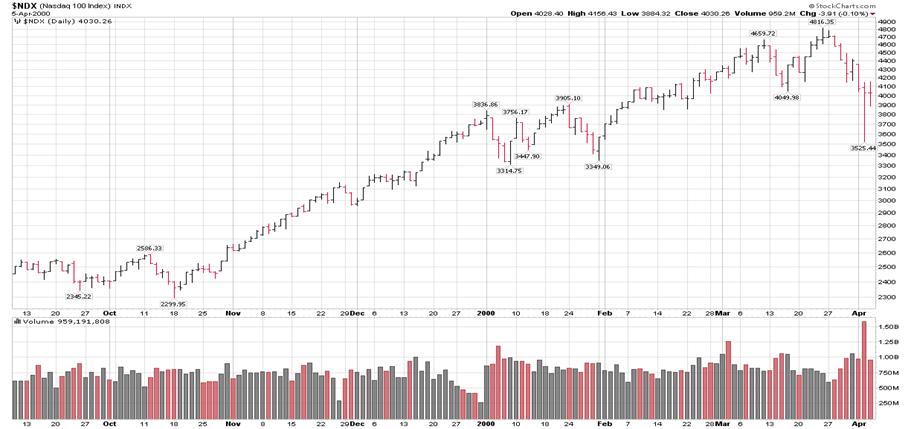
Since March 2009, equity markets have been in been in a strong bear market rally, similar in fact to ones experienced from late 1929 in the Dow 30 Industrials Index, from June to October 2000 in the Nasdaq 100 Index after the first leg of the Tech Share bust and in the Australian Mining market Index between May and October 1970.
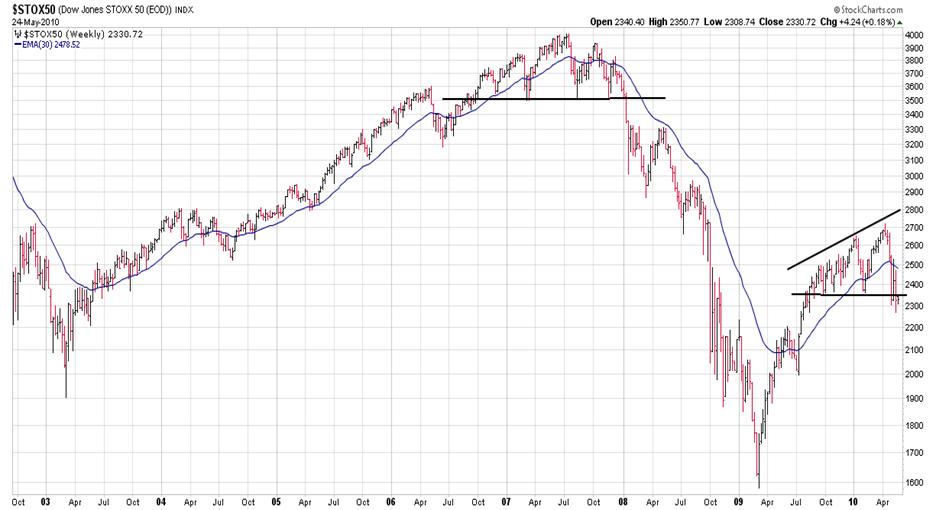
Across the board, composite indexes are showing what appears to be maturing tops going back to early August. Note the broadening formations mentioned earlier, such as the one below in the European STOXX 50 Index. The degree of conformity across the world suggests when one market goes, they all will.
I classify this type of event, not as a “black swan event” but a “grey swan event” – as all the evidence was there for all to see, it was just ignored.”
On May 9th 2010 in my next private client newsletter I stated that:
“. . . . . Well a lot can happen in a week.
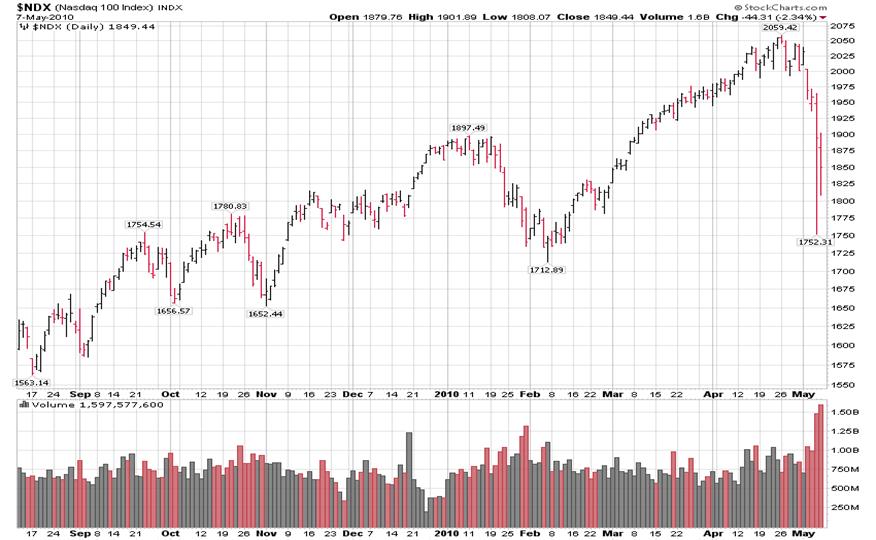
Historically, single day stock market declines as witnessed last Thursday, have been common as precursors to almost all major stock market declines. It is also a fascinating coincidence that the fall in the Nasdaq 100 Index on April 4th 2000 was identical to the fall in the same index last Thursday at 14.9% (See Daily Bar charts below). And in the year 2000, it happened without high frequency computerised trading.
By comparison, the fall on Monday October 28th 1929 in the Dow from the 301.22 high down to 260.64, was 13.6%, just a little shy of the percentage falls above.”
“These sharp falls or “flash crashes” in the early stages of major bear markets, also have at least one thing in common and that is their causes are rarely understood at the time.
Also on May 9th 2010:
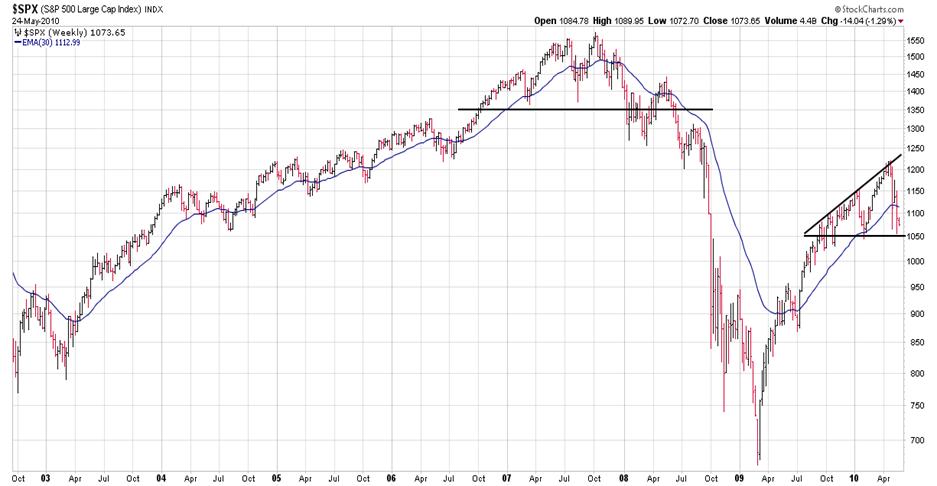
“The following charts show that as expected and like in 2008, markets are closing the gaps and will tend over time to move more in unison as they weaken and falls steepen. For example, the extended upward rally over the last few weeks on the S&P 500 has now been eroded by last weeks fall, and now conforms much closer to the broadening formation tops clearly observed in the other markets. Despite the fact that some markets are more advanced than others, there is broad conformity in the top patterns.
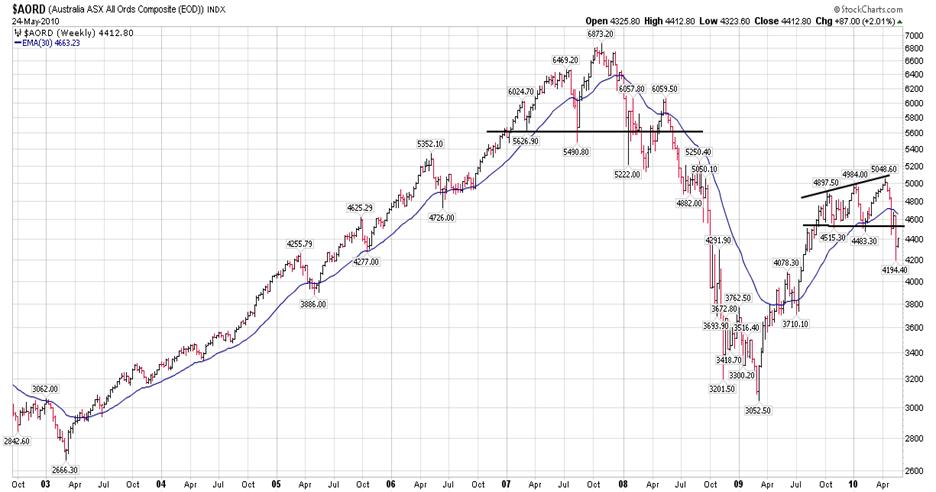
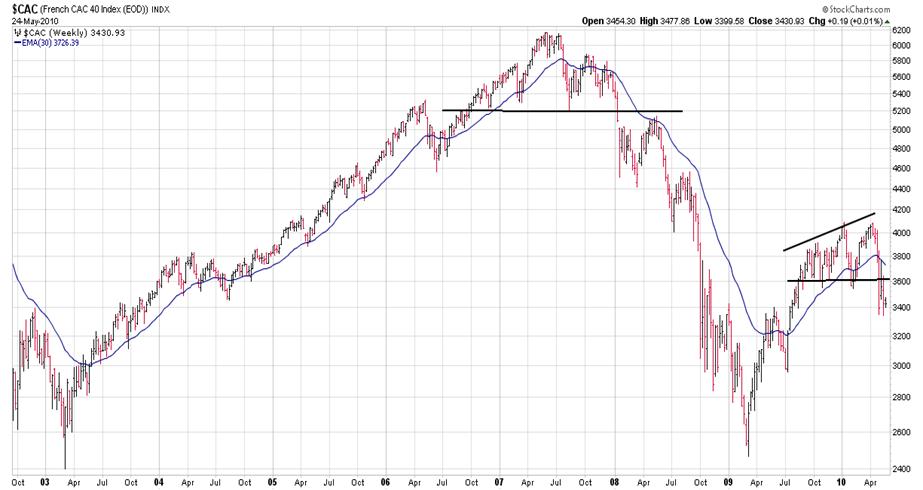
Of special interest is the French CAC40 Index which has broken support, confirming a major sell, while China SSEC Index and the Australian All Ordinaries Index are not far behind.
This extended move down in the French index, may be an indication of concern in the marketplace about the level of suspect debt exposure of French banks.
Despite the extent of last week’s move down, I do not expect much of a bounce at this stage. Quite the contrary. These market tops now are so extended and sentiment is now so jittery, further steep falls in the reasonably short term are certainly on the cards.
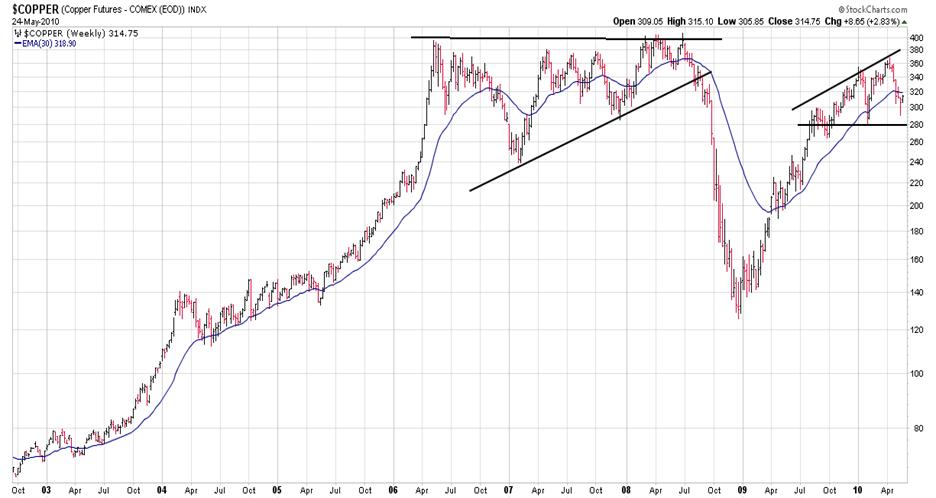
It should be noted that last weeks fall did not just come out of the blue. On Wednesday there was already a steep fall in the Copper price, quickly followed by oil and then the other markets followed suit.”
May 25th 2010 Comments
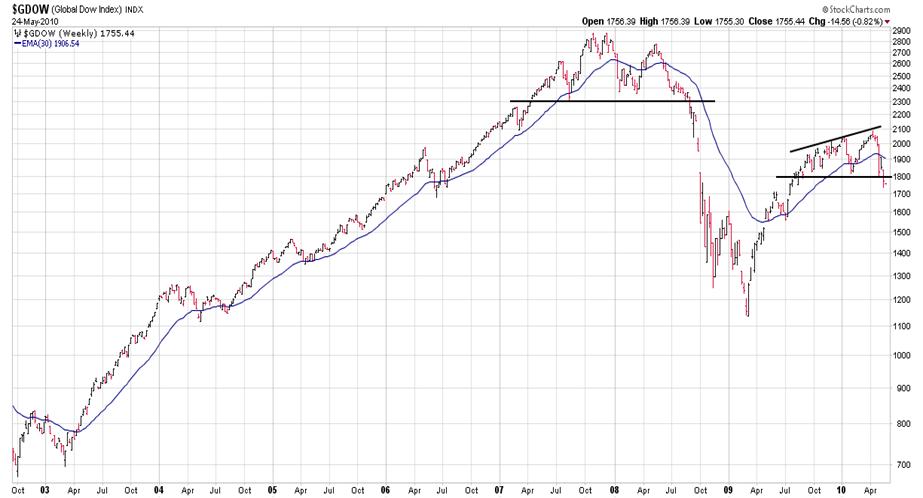
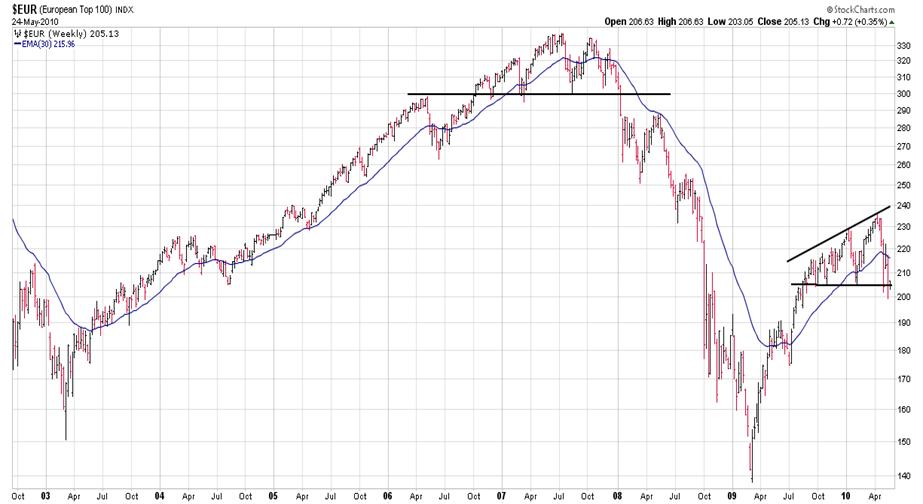
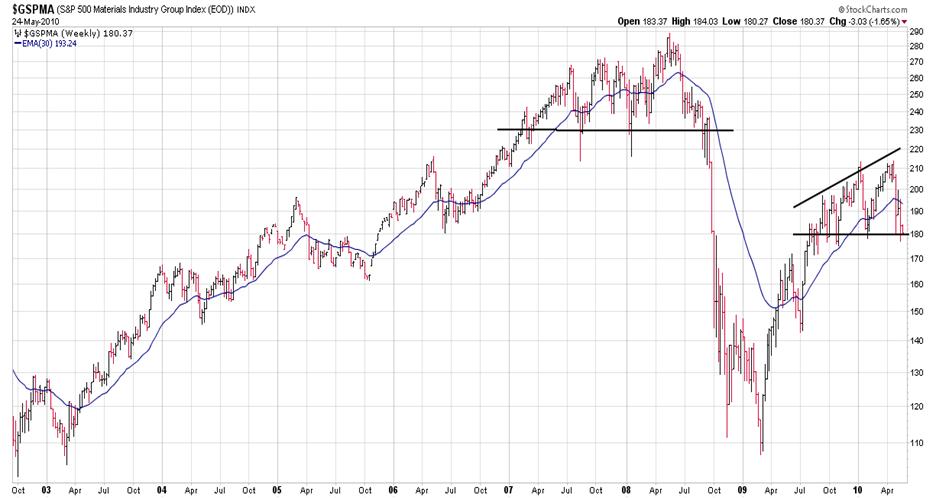
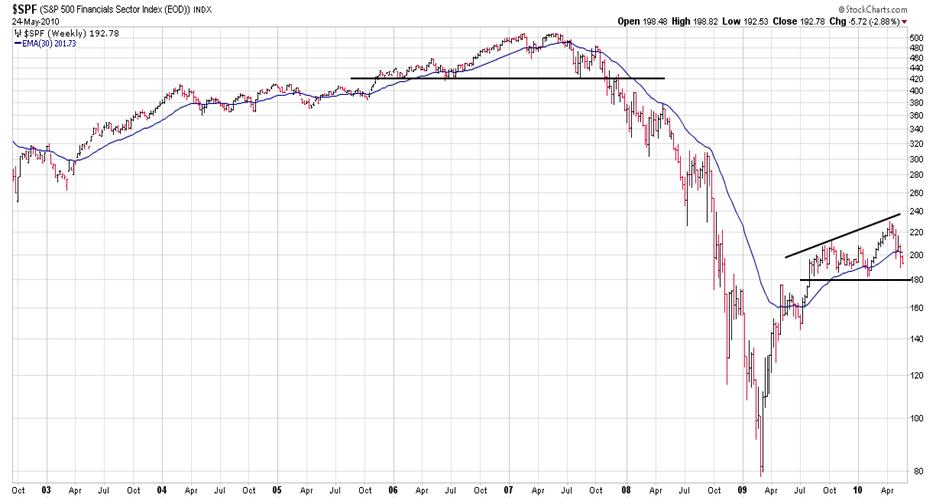
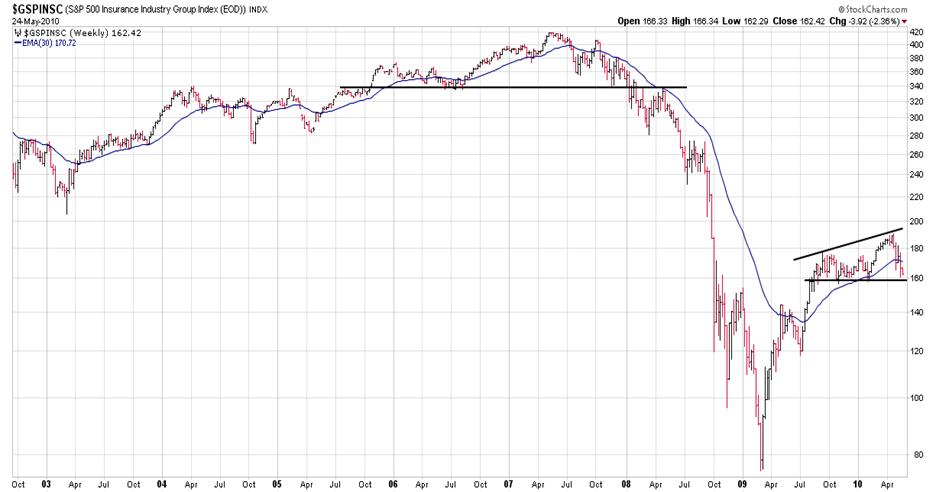
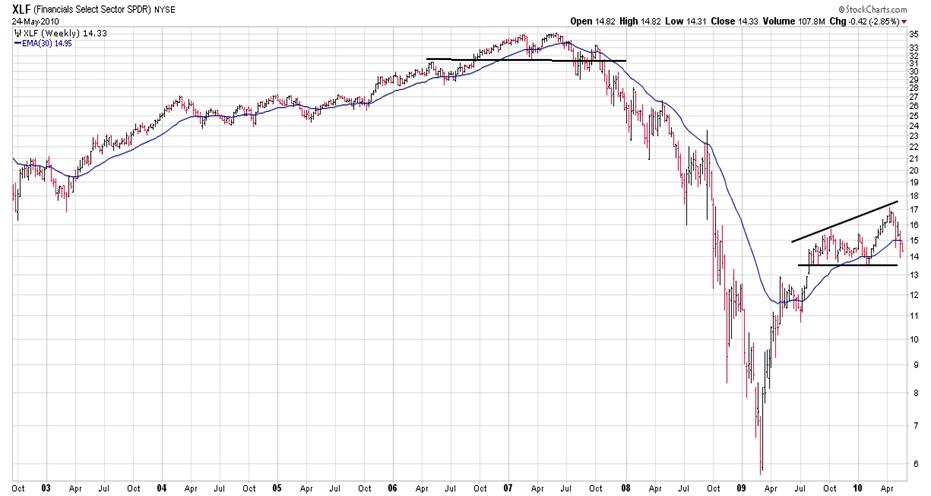
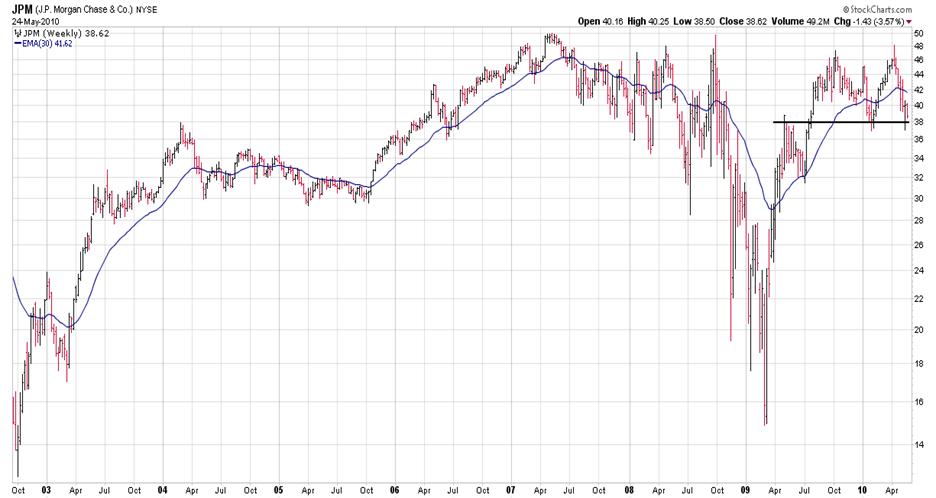
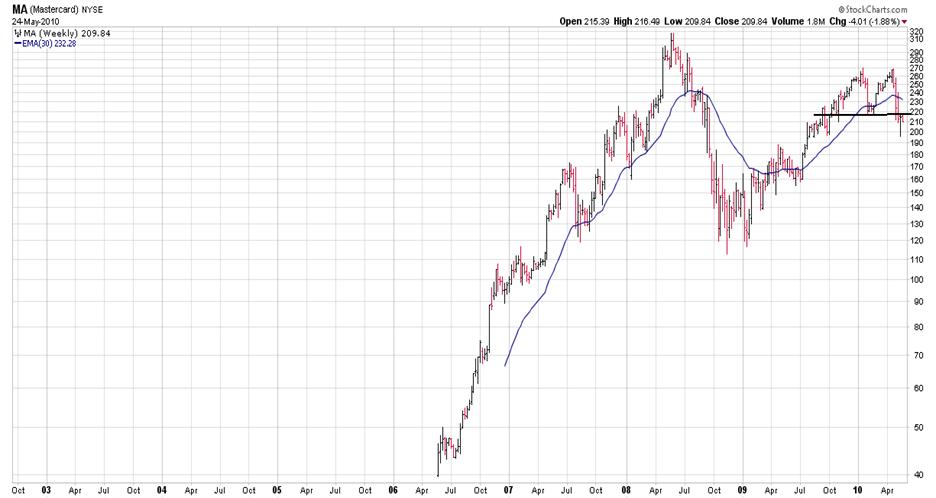
As you can see from the broad cross-section of weekly charts below there is significant conformity in the current top patterns – as their was in 2008 before the first crash. It is unlikely that equities will have the strength for any significant rally from here on if we go by the 80:20 rule. This allows for a 20% chance only for prices to hold or rise above support lines and form what I would call a “right side” to the top formations illustrated below.
Gold is tricky in USD terms, but short to medium term very bullish in terms of other currencies as long as the USD is rising.
© 2005-2022 http://www.MarketOracle.co.uk - The Market Oracle is a FREE Daily Financial Markets Analysis & Forecasting online publication.