


China Stock Market SSEC Index Completing Correction?
Stock-Markets / Chinese Stock Market May 20, 2010 - 02:52 AM GMTBy: David_Banister

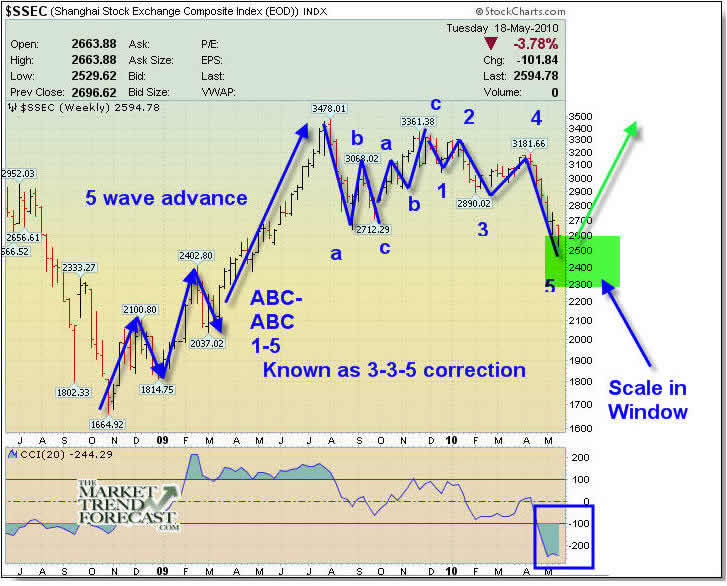
The recent Shanghai Surprise has been breaking that potential bullish triangle I outlined several weeks ago with a downside break of 2900. Subscribers to TheMarketTrendForecast.Com may recall that was my line in the sand for the SSEC index to remain bullish. With the break of that possible bull triangle, the SSEC index has fallen down to near 2500. Everyone on CNBC is bearish on the Chinese Indexes now, and I can’t find any bulls for that country either. They were everywhere several months ago, and now, nowhere to be found.
What I’m seeing as a possible intermediate “BULLISH VIEW” is that the Shanghai Index is completing what is known as a “3-3-5″ wave pattern. This means it’s an A B C zig zag to the downside, which works off the prior bull move from 1600-3400. So far this correction has re-traced a bit over 50% of that bull move, which would be typical and would kick everyone off the bull.
A 3-3-5 correction unfolds in a series of wave patterns. 3 waves down, 3 waves up, and then 5 waves down to complete. I outline this potential pattern below in the SSEC chart. This does not mean I will be right, merely that this is a very valid and normal corrective pattern after a massive bull wave up. The index is extremely oversold as well on traditional indicators, which I use to overlap my Elliott Wave views.
This forecast could mean some Chinese stocks are super cheap here, and it will be fun to watch the action from here. The index could drop to about the 2300 range and still validate this bottoming pattern. That means there could still be another 8% or so drop from here, but aggressive investors would start scaling into long positions over a few weeks. Indeed it was January of 2009 when I started recommending small cap indexes and mutual funds, but that index didn’t bottom until early March of course. Scaling in was wise though, as the TNA 3x ETF soared from 11 to 60 during the bull phase up. I started buying at 28 and down to 11, so my average was around 20 or so.
Worth watching anyways…
Dave Banister
CIO-Founder
Active Trading Partners, LLC
www.ActiveTradingPartners.com
TheMarketTrendForecast.com
Dave Banister is the Chief Investment Strategist and commentator for ActiveTradingPartners.com. David has written numerous market forecast articles on various sites (SafeHaven.Com, 321Gold.com, Gold-Eagle.com, TheStreet.Com etc. ) that have proven to be extremely accurate at major junctures.
© 2010 Copyright Dave Banister- All Rights Reserved
Disclaimer: The above is a matter of opinion provided for general information purposes only and is not intended as investment advice. Information and analysis above are derived from sources and utilising methods believed to be reliable, but we cannot accept responsibility for any losses you may incur as a result of this analysis. Individuals should consult with their personal financial advisors.
© 2005-2022 http://www.MarketOracle.co.uk - The Market Oracle is a FREE Daily Financial Markets Analysis & Forecasting online publication.