


Indian Stock Market Detailed Technical Analysis with Chart studies
Stock-Markets / India May 08, 2010 - 08:29 AM GMTBy: StocksBuddy

 As we have been stating repeatedly in our previous analysis, this week we were expecting negative divergence to kick in, and it clearly did. Nifty failed every move to cross the middle line of the BB channel as can be seen from the chart below. Nifty just followed the wrath of global markets to the downside with no pause at all.
This week nifty finally broke down from the tight trading range pattern. Nifty lost nearly 5% for the week. However this performance was better compared to S&P 500 in the US that lost nearly 6.5%. This shows the strength in the Emerging markets as investors are not really keen on selling into panics. That doesn't necessarily mean nifty cannot or will not go down further. The Rate Of Change (ROC) also matters a lot as it shows the underlying confidence and strength in a stock/index.
Technically Speaking:
Take a look at the Daily Nifty chart below.
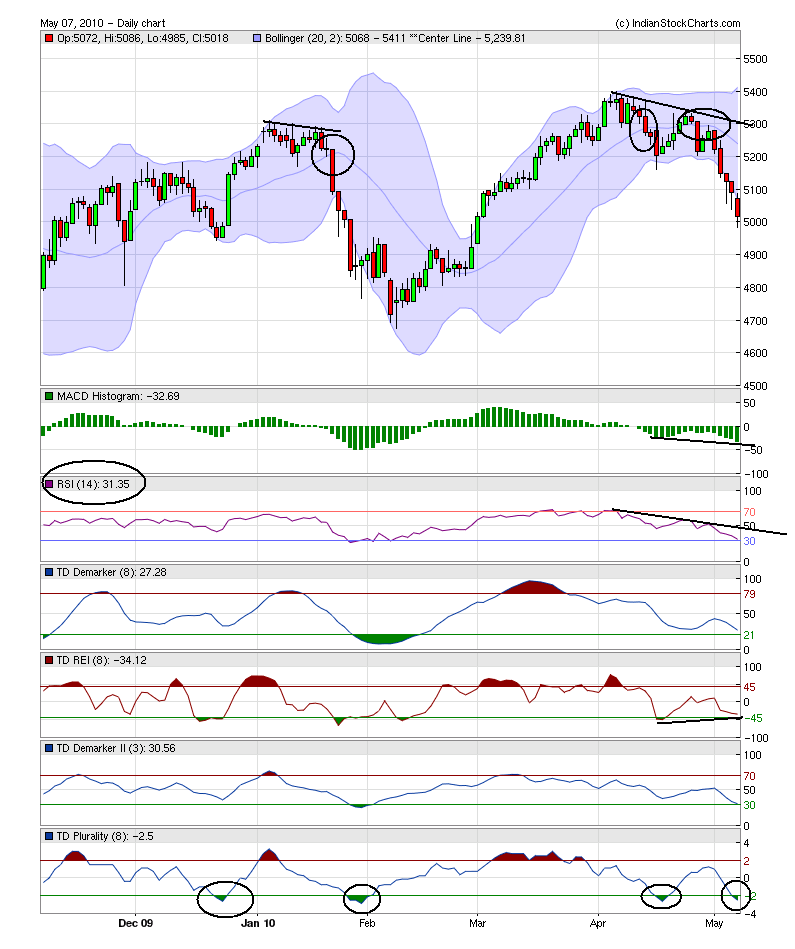
The above chart uses TD Demark indicators extensively.
Positives:
- None in particular.
- Historically, each time TD Plurality indicator moved below -2 and above it, market has found a short term bottom as you can see from the chart
- TD REI sort of developing positive divergence.
- May be too oversold as Nifty kept challenging the lower BB each and every day.
- RSI going down the hill and pretty fast. Not good at all. Add to it, the negative divergence and downtrending resistance/slope.
- Way below the middle BB line means more downside action possible. As you can see, once nifty crosses this line, it goes on in that direction for at least a few more sessions.
Next Week:
Weekly chart is as bad as the daily one. Nifty broke below middle BB line with a brute force and a big red candle. MACD histogram also moved to the negative territory.
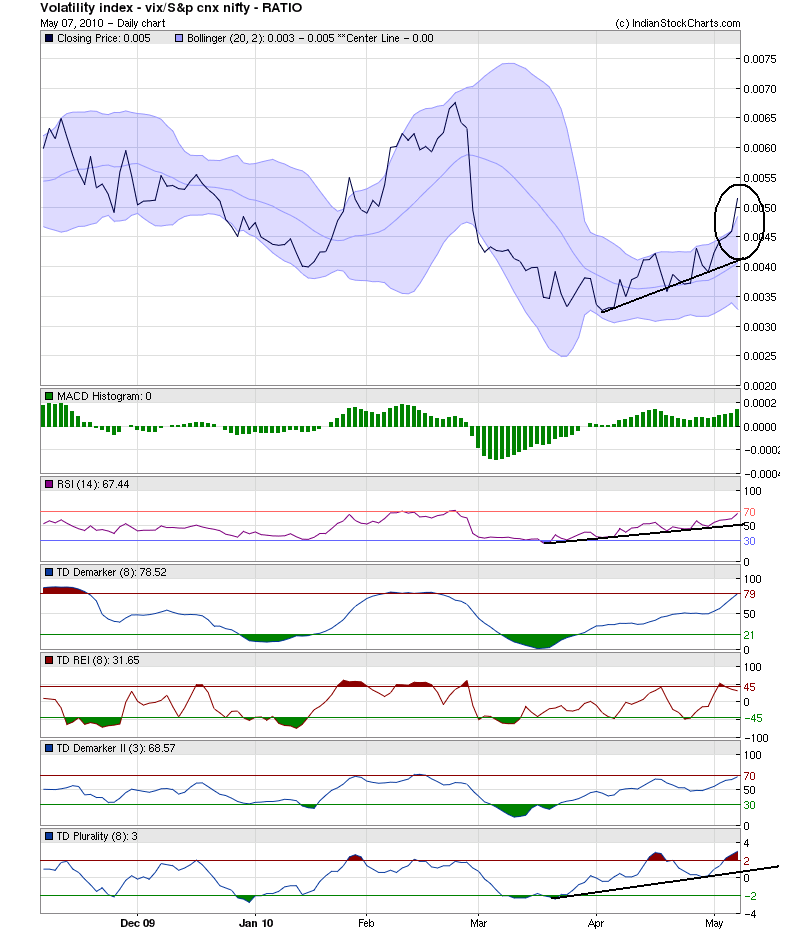
The chart below is the ratio chart of Indian VIX (Volatility index) to Nifty. This chart shows the correlation between Volatility and the moves in Nifty. The lower this chart, the higher the chances for Nifty to move up and vice-versa. We clearly have been stressing on the importance of this ratio chart staying above 0.0040 as being extremely negative for nifty. We also have been showing bunch of positive divergences on this chart that would lead to downside on nifty. And that worked out as predicted, this week.
After a long while, this ratio has actually managed to close outside of the Upper BB. This means, there is much more downside in nifty that is expected. However, there may be a bounce in the next few sessions owing to the extreme overbought nature of this ratio chart AND oversold nature of indices.
Trades for Next week
Last week we clearly stated that If you have already initiated a short position, trade with strict SL and that it was NOT a good time to go long. Our stance this week hasn't changed a bit. Friday US markets closed in red and which would mean that there is a high potential of nifty opening lower. However, we expect some bounce in the first part of next week owing to the extreme oversold nature in the very short term (VST). It may be a good idea to lighten some of your short positions and wait for the next opportunity to either go short or long. Do not go long or short in the next week, unless your trade duration is intraday or at most 1-2 days.
Alerts : Gold Broke out this week. Extremely Bullish. Might retest previous breakout levels, but it is a clear BUY at this time.
Have a Wonderful Trading Week ahead.
Regards
Disclaimer: At the time of this writing, neither the authors nor our team held any positions on any securities unless otherwise explicitly stated. All information above is only for educational purposes and you are responsible for your own actions.
India's No.1 Trading Community From the desk of StocksBuddy.com Analysts comes the above article. SB Analyst team comprises of experts from varied fields such as Technical Analysis, Fundamental Analysis, Macro-Micro Economics, World Affairs, Currency and much more. Apart from user contributions, our analysts post analysis on StocksBuddy.com on a regular basis. For more details, please visit us @ http://www.stocksbuddy.com/blogs
© 2009 Copyright StocksBuddy - All Rights Reserved
Disclaimer: The above is a matter of opinion provided for general information purposes only and is not intended as investment advice. Information and analysis above are derived from sources and utilising methods believed to be reliable, but we cannot accept responsibility for any losses you may incur as a result of this analysis. Individuals should consult with their personal financial advisors.
© 2005-2022 http://www.MarketOracle.co.uk - The Market Oracle is a FREE Daily Financial Markets Analysis & Forecasting online publication.