


Stock Market Sentiment and Monetary Aggregates - Watch Out Paperbugs!
Stock-Markets / Money Supply May 02, 2010 - 04:15 PM GMTBy: Adam_Brochert

 The whole M1/M2/M3/MZM (among others) monetary aggregate thing is pretty dry and I am no expert on which one is most important and the fine distinctions between them. It's all paperbug drivel to intellectualize an unsustainable debt-backed paper currency system in my opinion. However, one thing is clear: when the higher monetary aggregates (e.g. M2 and M3) start declining precipitously, you can bet a recession is on the way with a high probability of being right.
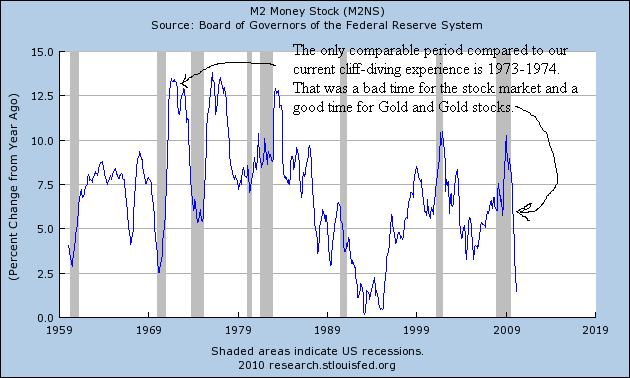
The rate of change of money and credit is an important concept to me. If access to money and credit is abruptly cut-off (like over the past 2 years), the economy gets temporarily choked off. If the market is abruptly flooded with money and credit, a cyclical recovery is likely already in progress. There is a lag and the relationship is not 1:1 or even tradable really, but current monetary data are one more bearish piece of information confirming that an important top in the general U.S. stock market is building.
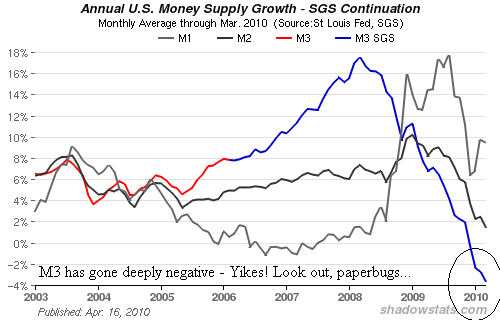
Following is some M2 and reconstructed M3 (M3 is no longer published) data in chart form. First is M2 using the year-over-year percentage change from a federal reserve website, and following that an M1, M2 and reconstructed M3 from shadowstats.com:
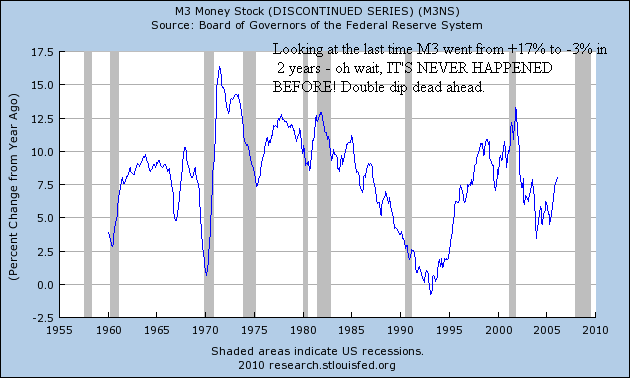
And from the fed website for perspective, here is a chart of the now discontinued M3 series year-over-year rate of change from 1960 thru 2006:
This is why the fed is not all-powerful. They can increase base money at will and engage in illegal back door monetization at will and with no oversight - in other words, way too powerful but not all-powerful. However, the multiplier effect requires willing lenders and borrowers. When that doesn't occur, the thought is that government should take on more and more debt to "stimulate" the economy and "pick up the slack." This is retarded, but it is our current system. The real economy is withering on the vine even as the too-big-to-fail banking system is being made partially whole at the taxpayers' expense and most of the major governments around the world are setting themselves up for Greek-style debt crises. Remember that corporate profits outside of the largest firms sucking on the government teat require actual healthy economic activity once costs (including employees) have been cut to the bone.
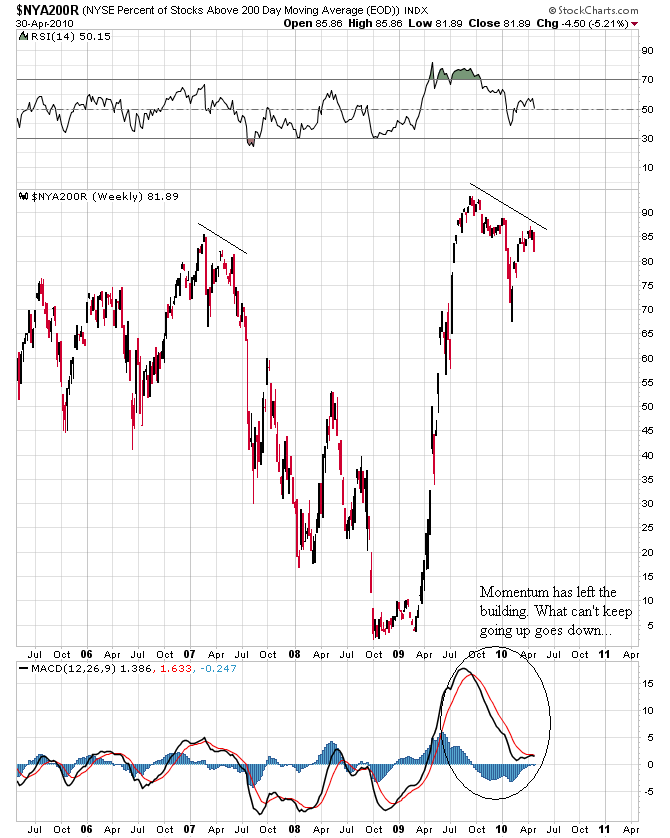
The number of New York Stock Exchange ($NYSE) stocks above their 200 day moving average ($NYA200R) is waning and looks set to plunge. Here's a 5 year weekly candlestick chart of the action:
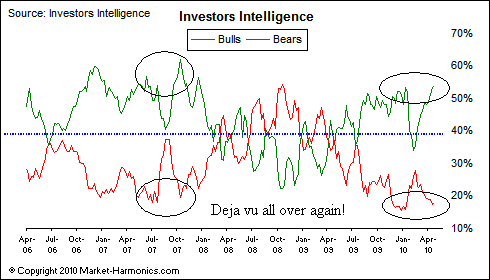
And here's the current Investors Intelligence data regarding bullish versus bearish sentiment with a chart over the last 4 years to provide some perspective on the current data points (chart from market-harmonics.com):
Speaking of sentiment screaming that a top of importance is at hand in the general stock markets, how about a few more charts from market-harmonics.com. The most insane is the NASDAQ sentiment index:
Let's party like it's 2000 in tech stocks, eh? Totally ridiculous and setting retail investors up for big losses. How about the options buyers sentiment gauge being at new bullish sentiment highs for this bear market:
And I posted a different version of this chart a few weeks ago, but one more time here is the CBOE equity put to call ratio:
Now that everyone is so bullish, I can't imagine what could possibly go wrong - hmmmm. I guess we'll find out as the Dow to Gold ratio works its way back to 2 (and we may well go below 1 this cycle). Gold up, Dow down coming soon to a market near you. The secular general stock bear market is far from over - don't lose the forest thru the trees. The few stock market bears left could be about to have a field day, as everyone may panic quickly when we start heading down again.
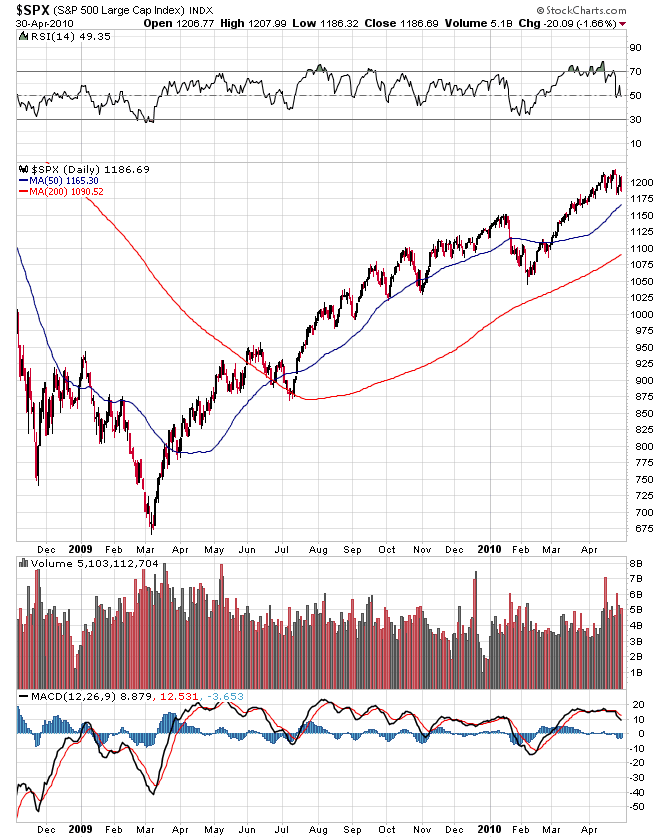
Finally, I leave you with some Sunday morning fractal chart porn. Here's the current reflationary cyclical bull market using an 18 month candlestick daily chart:
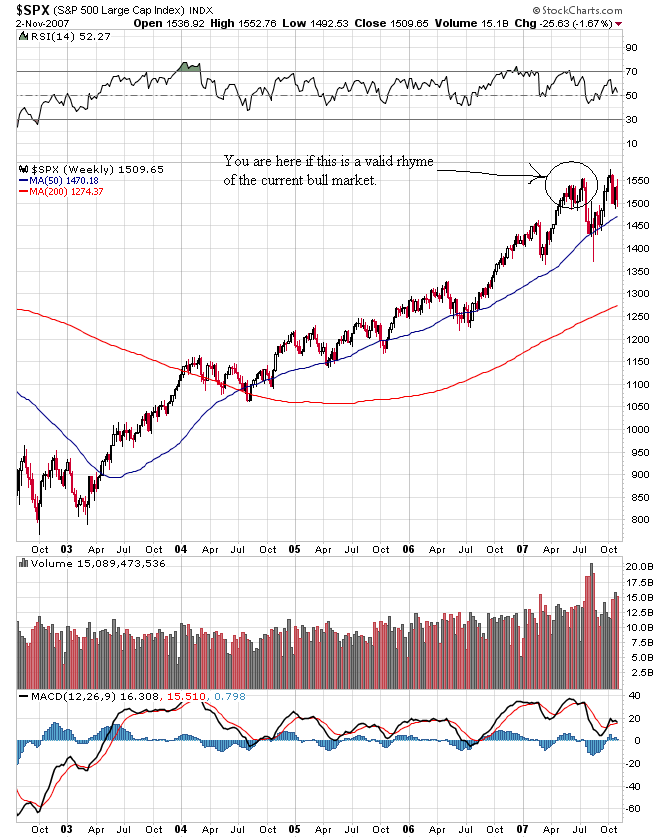
And here's a WEEKLY chart of the last cyclical bull market in the S&P500 from 2003-2007 when we had more ammunition to stimulate the economy with and more room to increase debt in the private and public sector:
Visit Adam Brochert’s blog: http://goldversuspaper.blogspot.com/
Adam Brochert
abrochert@yahoo.com
http://goldversuspaper.blogspot.com
BIO: Markets and cycles are my new hobby. I've seen the writing on the wall for the U.S. and the global economy and I am seeking financial salvation for myself (and anyone else who cares to listen) while Rome burns around us.
© 2010 Copyright Adam Brochert - All Rights Reserved
Disclaimer: The above is a matter of opinion provided for general information purposes only and is not intended as investment advice. Information and analysis above are derived from sources and utilising methods believed to be reliable, but we cannot accept responsibility for any losses you may incur as a result of this analysis. Individuals should consult with their personal financial advisors.
© 2005-2022 http://www.MarketOracle.co.uk - The Market Oracle is a FREE Daily Financial Markets Analysis & Forecasting online publication.