


Global Debt Crisis Hits Markets, The Moment of Truth is Upon Us
Stock-Markets / Financial Markets 2010 May 02, 2010 - 04:26 AM GMTBy: Steve_Betts

 We started out the week with a bang when it was announced that Goldman Sachs was being charged with fraud by the SEC. This sounds ominous at first glance, but in the end it’s a civil matter and will result with no more than a fine and a slap on the wrist. Then toward the middle of the week when the ratings agencies began to write down sovereign debt, first with Greece and then a day later with Spain and Portugal. It seems to me that these agencies no longer serve a purpose as these downgrades are nothing more than an acknowledgement of a situation that we all know existed for quite some time.
These countries didn’t fall deep into debt overnight; rather it’s a process that began years ago. The idea of the ratings agencies is supposedly to give the general public a “heads up” that a potential problem exists. Unfortunately, these agencies are now so far behind the curve that their pronouncements pass for bad humor.
Even more humorous is the selection process. I suspect they now resort to darts and a board when deciding who they’ll downgrade and who they won’t. Take a look at the following chart prepared by the Carnegie Institute and then I will expound:
Here you see a list of countries and their respective government debt as a % of GDP and it runs through the end of 2009. Japan is by far the worst offender and then you have Italy, Greece, and the United States. Both Spain and Portugal are considerably better off than the United States and yet they were both downgraded. What’s not shown here is the 2010 estimate for the United States that has debt as a percentage of GDP at 112%, moving them up into second place behind Japan. Finally, note that Russia has the lowest percentage of debt to GDP of any developed country!
Debt is now a worldwide problem and the cause has to do with the central banks’ propensity to print fiat currency. Everybody was in a rush to devalue their respective currency so they could have the edge in the export arena, but they forgot that all those fiat bills would have to be absorbed. In order to make that happen they lowered rates making credit dirt cheap. Banks gave money to consumers and the Alan Greenspan’s of the world told us to spend all we wanted. Three houses were better than two and trees could grow to the sky. Everyone seemed to forget that a loan needed to be productive in order to add something to society, and worse yet debt was considered to be an asset by mid-2007. It was a strange mental alchemy that worked on the minds of consumers, and the promoter was the Federal Reserve. Finally, the mountain of debt rolled over and the consumer was crushed under the weight, but they weren’t the only ones to suffer. Banks were caught up in the undertow, and not just any bank, but banks considered too big to fail.
The break occurred in late 2007 as markets, consumers, and banks all deteriorated until March 2009, when the Treasury and Fed announced a bailout plan designed to save the day. This plan was flawed in three ways: by what if failed to do, by its basic assumption, and finally by what it did. The Fed assumed that it could resolve a credit crisis by simply creating more debt, and that logic was and is seriously flawed. Then everyone forgot that the US was a consumer based economy, with consumption accounting for 73% of GDP, and the Fed did nothing to help the consumer. Finally, the Fed bailed out the too big to fail institutions with a trillion and a half dollars of your money. It was basically interest free and supposedly destined for the consumer. The banks knew better and instead squirreled it all away in fixed income investments that allowed them to make one hell of a spread. The consumer be damned, and he was.
In their infinite wisdom the Fed also allowed the banks to mark to market the hundreds of billions of dollars of worthless assets, i.e., legalizing the very practice that led to the credit crisis in the first place. So banks had great profits and up went the share price. All the better to then shovel out hundreds of billions of new stock and bond issues to an unsuspecting public, and then use the proceeds to pay off the TARP loans! So the banks received interest free loans, invested the free money at a huge spread, fixed any price they wanted on worthless assets, sold new debt to the public at inflated prices, and then gave themselves huge bonuses as a reward. Please
I would like someone to tell me where I can get a job like that. In the end the public gets bilked twice, first with the TARP loans and then with the new public offerings.
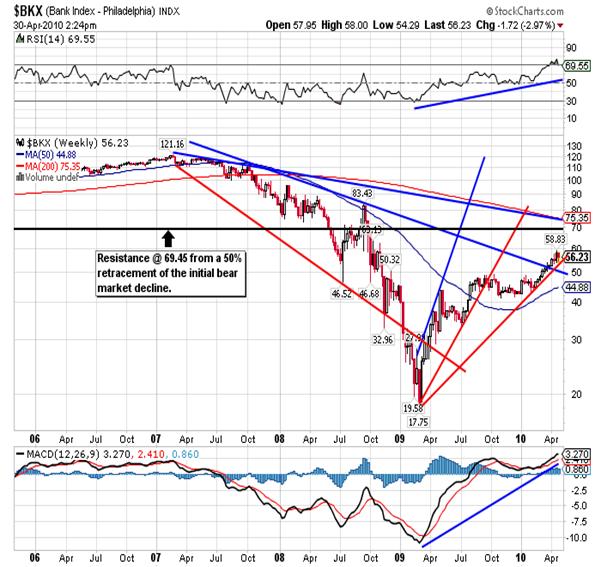
Now here is the really interesting part. Given everything that I’ve said, you would have thought that the banking sector would have gone right up through the roof, but that just wasn’t the case. First take a look at the preceding chart of the Philadelphia Banking Index and you’ll see that it failed to reach the 50% retracement of the initial bear market decline. Every major index in the US recovered more than 50% of the initial decline, but the Fed’s privileged child never came close. It received all of the benefits and yet lagged all the other market. Interesting to say the least! The market seems to be saying that it doesn’t buy into the too big to fail idea and appears to doubt that the Fed has offered any real solutions to solve real problems.
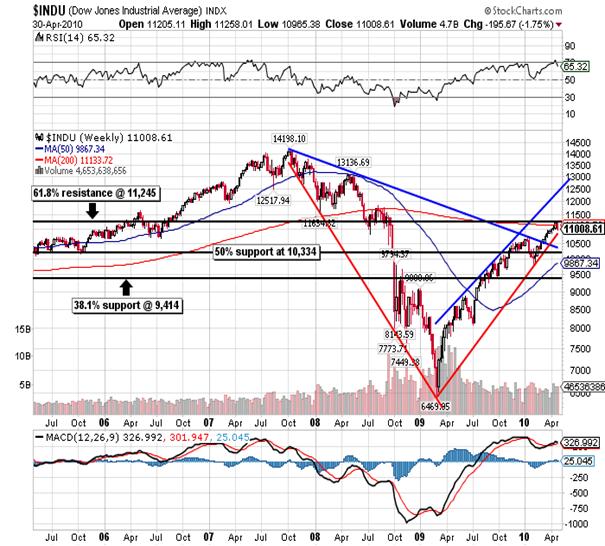
So banks are lagging and yet the Dow surged higher in spite of whatever bad news was thrown at it. It’s rallied so much that everyone now assumes that we are in a new bull market. I have gone against the trend and maintain that we are in the second phase of a major bear market. The first phase was the initial move down from the 14,164.53 all-time high in October 2007 to the March 2009 low of 6,469.95. The second phase involves a bear market rally that has retraced almost exactly 61.8% of that initial decline producing a closing high of 11,205.03 on April 26th and an intraday high of 11,252.11 on that same day. For those of you keeping score a 61.8% Fibonacci retracement would take you to 11,245.85, seven points below the intraday high on the 26th. That in itself is not much to get excited about, but there is something else that occurred on Thursday and I missed it altogether.
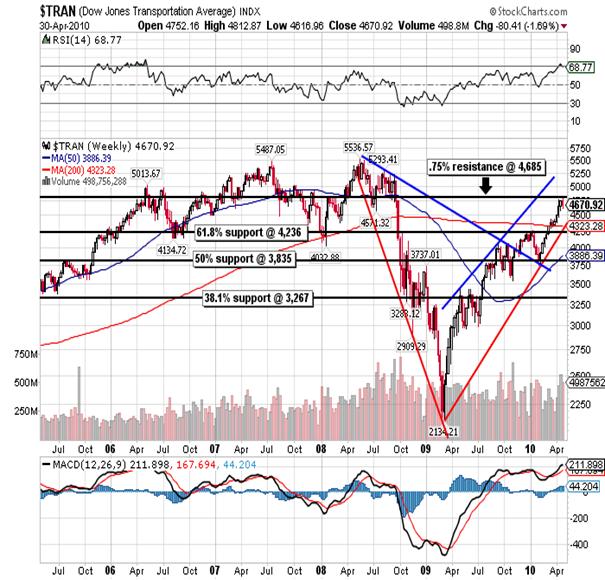
As I stated earlier the Dow made a new closing high of 11,205.03 on April 26th and that closing high was confirmed by a new closing high in the Transports. That was on Monday. On Tuesday we saw the Dow fall 200 plus points and then Wednesday flowed with a small rally. On Thursday the Dow rallied 122 while the Transports rallied to a new closing high of 4,762.71 and that was not confirmed by the Dow. On Friday both Indexes then suffered significant losses. The other thing to take away is that the Transports are definitely leading the Dow. On the days when we saw big price changes in the Dow percentage wise, there were much bigger price changes in the Transports percentage wise. That mean the Transports are now leading the Dow, just like they did when they made their unconfirmed all-time high at 5,536 back in April 2008. Now the Transports have made another unconfirmed high where as for the last year it’s been the Dow dragging the Transports higher. That is a big change in character and it’s not to be taken lightly. Finally, take into consideration that the PER for the Transports is an astounding 129 while the average yield is less than 1% and can see why this looks like a top. Nobody’s noticed this and no one is talking about it.
Turning our attention back to the Dow for a minute, we can see that it met
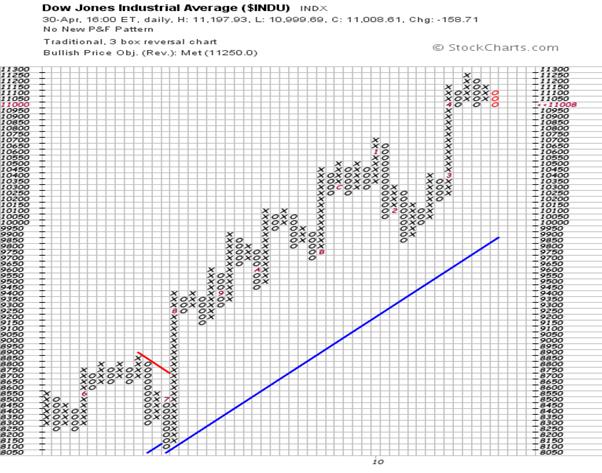
the bullish price objective of 11,245 and has formed a flag formation. Any further decline next week will break it out to the downside and not be a good omen. Given everything that has transpired over the last five sessions, what transpires early this coming week will be of considerable importance. What could make this high so devastating is the fact that absolutely no one sees it coming and all the news is so upbeat.
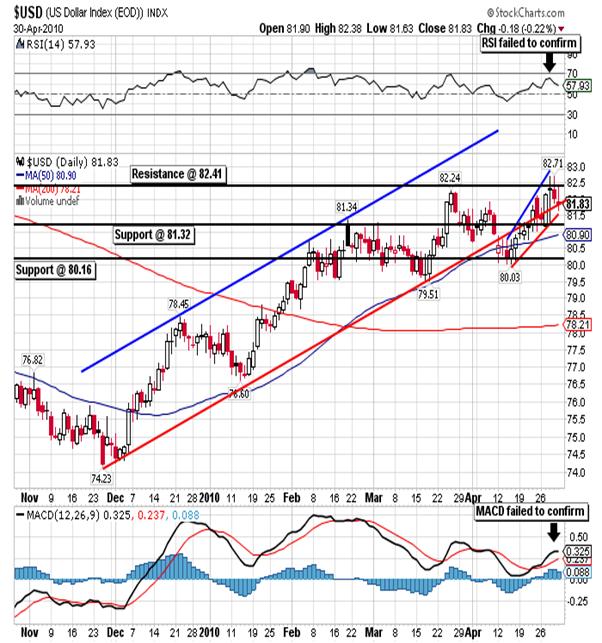
Another market on the edge of change, one way or the other, is the US dollar. On March 25th the spot US Dollar Index made a closing high of 82.16, and an intraday high of 82.24, as it tested strong resistance at 82.41. Then we saw a slow decline down to a closing low of 80.18, testing strong support at 80.16, on April 14th. This was in turn followed by a rally to a marginally higher closing high at 82.32 on April 28th and was a second test of the 82.41 resistance. As you can see in the daily chart above, this new closing high was not confirmed by RSI or MACD. Also, throughout the run up to the marginally higher closing high, I noted that the dollar would post significant gains during the night Globex sessions, only to give back part or all of those gains as the New York session moved toward the close. When trying to figure out what the next move will be in price, it sometimes helps to look back at past behavior:
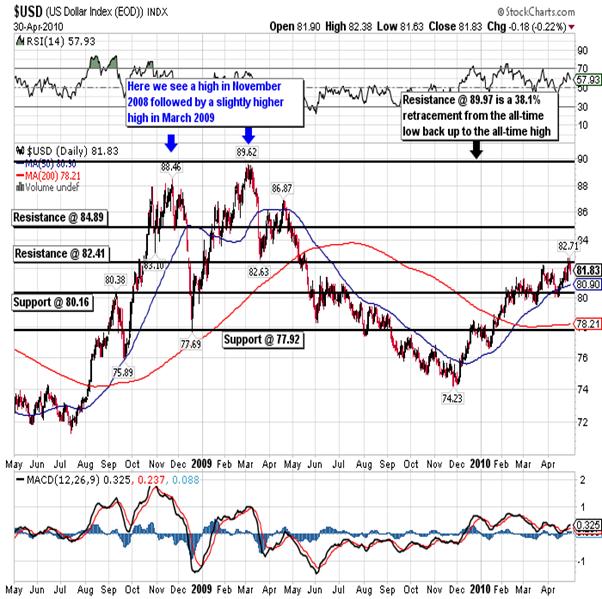
We can see that the dollar made a significant high in late 2008, and after an initial decline, put in a marginally higher high several months later. The marginally higher high was also not confirmed by RSI or MACD, so now we can make a case for a specific pattern of behavior.
I tend to view the behavior of the dollar as a continuation of the decline from the March 2009 high of 89.62. From that head-and-shoulder top formation we saw an initial decline down to a low of 74.23, and now we are having a reaction. In my opinion this reaction is either topping here at 82.41, or will top at 83.35. There will not be a new bull market for the greenback and there never will be as long as the following condition exists:
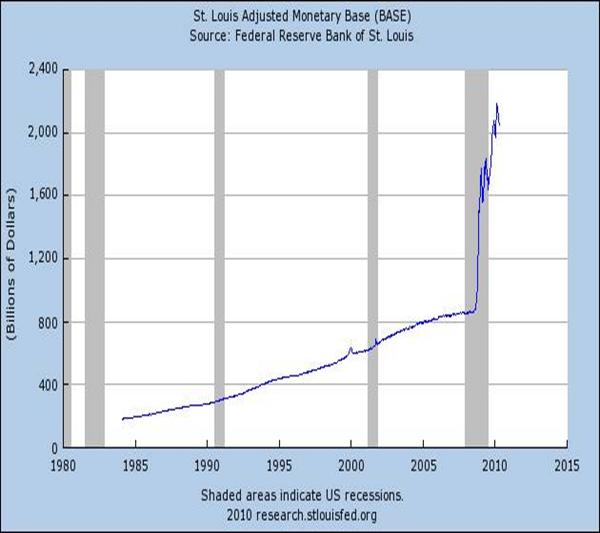
No bull market will ever develop for an item where the supply expands exponentially. The best you can hope for is the occasional reaction from extremely oversold conditions and that is what we are living now.
Why then aren’t we seeing the inflationary effects from such an expansive monetary policy? The simple answer is that this money is not filtering down to you and I, and it never will. This tremendous surge in fiat currency, and not just in the US but around the world, is going to fill the huge black hole of debt in a very selective group of financial institutions. As we’ve seen throughout time, when you pull on a lose thread, sometimes the whole shirt unravels. Back in 2007 the Fed had two options: write off debt or create and even bigger mountain of debt. With Paulson, Geithner and the rest of the Goldman crew in charge, no one would write of debt and close these too big to fail institutions down. Instead they would create huge amounts of new debt and allow Goldman to front run everything they do. The problem now is that all the debt produced nothing and you have to service it at a significant cost. That cost of servicing the debt is the only thing that sustains the dollar at this point in time. That pressure cannot last much longer and may already be priced in. That’s why the dollar is a good short sale right now.
So if stocks and the dollar are not the place to go, what do you do with your cash? I can answer that with one word, gold! Compared to the hype in the Dow and related stocks, the current move up in the price of the yellow metal is going almost unnoticed. On Friday the spot price closed out the day in New York at 1,179.20 as every attempt to sell the metal off during the week was met with strong buying. Yet almost no one is talking about it and the general public, for the most part, is not aware that gold exists. There were two keys to the current move:
- The fact that gold held critical support at 1,077.60 back in February when everyone was calling for 900.00 gold, and
- Gold was finally able to break and close above the critical 1,148.70 resistance. I say critical because this was the resistance from the 50% extension from the old all-time high at 850.00.
The combination of these two events, together with some formations that I will talk about shortly, signaled to smart investors that a large move up was in the wind.
If you focus on the following daily chart for gold you’ll see that I highlighted not one, but two upside down head-and-shoulders formations. The first is a larger formation with a neckline that comes in at 1,000.00 while the second came later, is smaller, and finished at a higher level with a neckline at 1,137.00. It is also no accident that both of these necklines were at significant Fibonacci resistance levels:
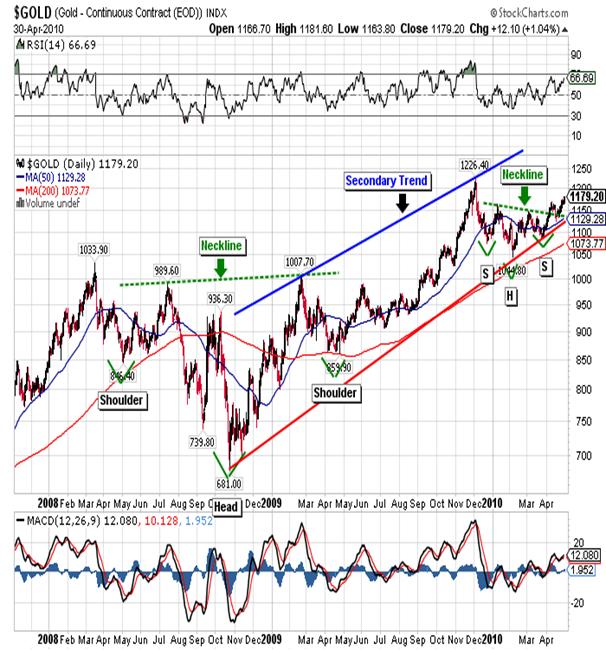
Perhaps the most important feature is that the smaller upside down head-and-shoulders formation includes a recent series of higher highs and higher lows. What’s more the entire movement since the December 2009 all-time high can be considered a period of consolidation, a base if you will, that will now support a move to a new all-time high.
Gold tested strong resistance at 1,219.2 in late last year with an intraday high of 1,226.40 on December 3rd and an all-time closing high of 1,216.00 on December 2nd. Gold has no resistance levels between Friday’s closing price and the December 2009 all-time high, and we will see a test of this high sooner rather than later. Aside from that a good long look at the previous chart shows not one, but two periods of consolidation and accumulation:
- The first lasting 19 months, from March 2008 thru September 2009, using 1,000.00 as a ceiling, and
- The smaller second period from December 2009 to date and using the all-time high as a ceiling.
Once this latter resistance is broken, gold will experience a significant rise in price, regardless of what anyone thinks, and regardless of what anyone does. For those of you still waiting for 900.00 gold, I wish you luck with that strategy. Gold is going first to 1,219.20, then to 1,298.10, and on to 1,372.80, and it may even go as high as 1,447.50 before it runs out of gas. Yes, there will be volatile reactions along the way, but they will be just that, reactions. Everybody will say how the bull market is over, gold is overvalued, it’s a sucker play, and so on… My advice is to turn all the noise off and go fishing for a couple of months.
In conclusion, we are headed for trouble and trouble is now knocking on the door. You may recall that in the April 29th Daily Report I mentioned that the FDIC had taken over fifteen banks in an eight day period from April 20th to April 27th, and the pace seemed to be quickening. Well on Friday the FDIC announced seven more bank closings:
Frontier Bank Washington
BC National Missouri
Champion Bank Missouri
CF Bank Michigan
Western Bank Puerto Rico
R-G Bank Puerto Rico
Eurobank Puerto Rico
bringing the total for a ten day period to 22 banks! Aside from this you have another 160 banks on the unofficial FDIC “problems list”. None of that made the news. Then you have Harrisburg, the capital of Pennsylvania, discussing the city’s possible filing for bankruptcy in a very public forum. By the way Harrisburg is just the very small tip in a very large municipal and state debt malaise that most people are oblivious to.
Our benevolent government continues to practice the fine art of economic black magic, while at the same time painting the books. We have a continual stream of politicians, complete with wonderful sound bites, telling anyone who will listen that all is well. I beg to differ, and given what I’ve seen this last week, I think the market is beginning to come out of the ether. Gold is literally climbing against all odds and this is a message that something is wrong. The more they try to push it down, the faster it comes back, and ignoring the message will not make it go away. I thought gold would have run much higher by now, but that’s because I wanted to see inflation. Deflation is the real problem and that slowed down gold’s rise. Then of course there is the double whammy of greed and lack of patience that always combine to make us try and see things that aren’t there yet. The market does what it wants to do, when it wants to do it. Now gold is doing it and the best is yet to come. The problem is that the best of gold means the worst of times for the world’s economy in general and disastrous times for the United States. For a society that created distortion after distortion in an effort to live beyond its means for three decades, there will be a hefty price to pay.
By Steve Betts
E-mail: team@thestockmarketbarometer.com
Web site: www.thestockmarketbarometer.com
The Stock Market Barometer: Properly Applied Information Is Power
Through the utilization of our service you'll begin to grasp that the market is a forward looking instrument. You'll cease to be a prisoner of the past and you'll stop looking to the financial news networks for answers that aren't there. The end result is an improvement in your trading account. Subscribers will enjoy forward looking Daily Reports that are not fixated on yesterday's news, complete with daily, weekly, and monthly charts. In addition, you'll have a password that allows access to historical information that is updated daily. Read a sample of our work, subscribe, and your service will begin the very next day
© 2010 Copyright The Stock Market Barometer- All Rights Reserved
Disclaimer: The above is a matter of opinion provided for general information purposes only and is not intended as investment advice. Information and analysis above are derived from sources and utilising methods believed to be reliable, but we cannot accept responsibility for any losses you may incur as a result of this analysis. Individuals should consult with their personal financial advisors.
© 2005-2022 http://www.MarketOracle.co.uk - The Market Oracle is a FREE Daily Financial Markets Analysis & Forecasting online publication.