


UK House Prices Rise by 10%
Housing-Market / UK Housing Apr 29, 2010 - 05:06 AM GMTBy: Nationwide

 • House prices increased by 1.0% monthon-
month in April
• House prices increased by 1.0% monthon-
month in April
• Annual rate of price inflation moves into
double digits for first time since June
2007
• House prices are 10.0% below the
October 2007 peak
Commenting on the figures Martin Gahbauer, Nationwide's Chief Economist, said:
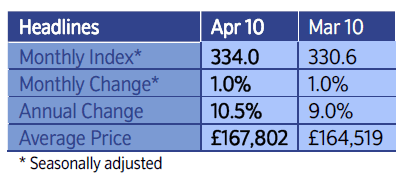
“The price of a typical UK property rose by a seasonally adjusted 1.0% month-on-month (m/m) in April, leaving house prices 10.5% higher than a year earlier. Over the lifetime of the last Parliament (May 2005 to April 2010), house prices have risen by 6.7%. This compares to a 13.5% increase in the consumer price index, the official target measure of inflation.
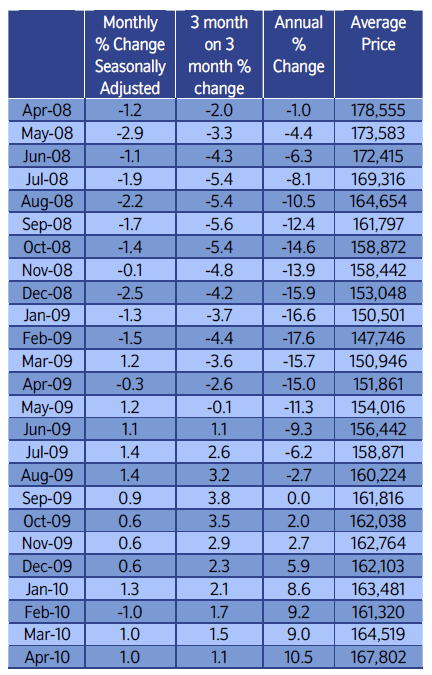
“April’s figures show the first double-digit annual growth in UK house prices since June 2007. The year-on-year rate in this month’s figures, however, received an additional boost from the fact that April 2009 was one of the weaker months last year. Given the very strong performance of house prices from May 2009 onwards, it will take monthly increases in excess of 1% for the annual rate of inflation to be maintained in double digits going forward. The smoother three month on three month rate of inflation edged down further from 1.5% in March to 1.1% in April, which primarily reflects the impact of February’s 1.0% decline in house prices. April’s figures leave UK house prices exactly 10% below the October 2007 peak.
What role are cash transactions playing?
 “The strong rebound in house prices over the last
year has taken place within the context of a subdued
mortgage market, with the number of mortgage
advances across the industry still well down on precrisis
‘norms.’ A natural question which therefore
arises is whether cash buyers have helped to boost
the market and bid up prices?
“The strong rebound in house prices over the last
year has taken place within the context of a subdued
mortgage market, with the number of mortgage
advances across the industry still well down on precrisis
‘norms.’ A natural question which therefore
arises is whether cash buyers have helped to boost
the market and bid up prices?
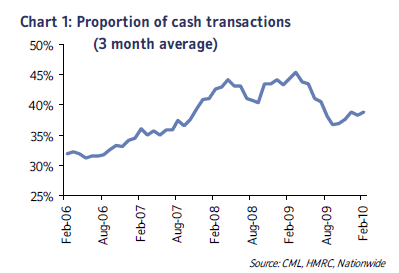
“Over the course of 2008 – when the credit crunch was at its most severe – there was indeed an increase in the estimated proportion of total housing transactions completed in cash. Cash transactions (i.e. non-mortgaged purchases) are estimated to have averaged 43% of the total in 2008 against 37% in 2007. This suggests that cash buyers did make some contribution to clearing the excess stock of housing on the market during the period in which mortgage finance was least available.
“However, since the beginning of 2009 the proportion of cash transactions has declined to a level only slightly higher than the average for 2007. Even in absolute terms, there was a decline in the number of cash buyers between 2008 and 2009. As such, the importance of cash buyers in the market started to decline at exactly the same time as house prices began the strong rebound that has lasted up until the present day. It is in fact the recovery in mortgaged transactions that has played a greater role in boosting total market activity since the early 2009 trough.
 “Rather than a surge in cash buyers, the more
important driver of rising house prices has been the
low level of stock for sale, as many homeowners and
buy-to-let landlords continue to wait for prices to
recover to peak 2007 levels before deciding to sell up
or move. The very low level of interest rates has been
supportive of this wait-and-see approach, particularly
in the buy-to-let sector. Many landlords have seen
their mortgages revert to base rate trackers and are
now earning significantly higher net rental income
than a few years ago. As a result, most can easily
afford to wait for prices to recover further before
selling.
“Rather than a surge in cash buyers, the more
important driver of rising house prices has been the
low level of stock for sale, as many homeowners and
buy-to-let landlords continue to wait for prices to
recover to peak 2007 levels before deciding to sell up
or move. The very low level of interest rates has been
supportive of this wait-and-see approach, particularly
in the buy-to-let sector. Many landlords have seen
their mortgages revert to base rate trackers and are
now earning significantly higher net rental income
than a few years ago. As a result, most can easily
afford to wait for prices to recover further before
selling.
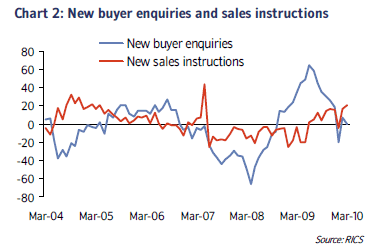
“Nonetheless, there has recently been evidence of a slight shift in the supply-demand balance. While the recovery in new buyer enquiries at estate agent offices appears to have petered out, the last few months have seen an increase in the level of new instructions from sellers. All else equal, this should lead to a gradual flattening out of the recent upward price momentum, and this is indeed what the 3 month trend in April’s figures shows.”
Monthly UK House Price Statistics
Note: Historical figures including index levels can be viewed using the following link: www.nationwide.co.uk/hpi/downloads/Monthly.xls
| Martin Gahbauer Chief Economist Tel: 01793 655434 fionnuala.earley@nationwide.co.uk |
Roy Beale Media Relations Officer Tel: 01793 655689 roy.beale@nationwide.co.uk |
Notes: Indices and average prices are produced using Nationwide's updated mix adjusted House Price Methodology which was introduced with effect from the first quarter of 1995. Price indices are seasonally adjusted using the US Bureau of the Census X12 method. Currently the calculations are based on a monthly data series starting from January 1991. Figures are recalculated each month which may result in revisions to historical data. The Nationwide Monthly House Price Index is prepared from information which we believe is collated with care, but no representation is made as to its accuracy or completeness. We reserve the right to vary our methodology and to edit or discontinue the whole or any part of the Index at any time, for regulatory or other reasons. Persons seeking to place reliance on the Index for their own or third party commercial purposes do so entirely at their own risk. All changes are nominal and do not allow for inflation. More information on the house price index methodology along with time series data and archives of housing research can be found at www.nationwide.co.uk/hpi
Nationwide Archive |
© 2005-2022 http://www.MarketOracle.co.uk - The Market Oracle is a FREE Daily Financial Markets Analysis & Forecasting online publication.