


Central Banks Stoking Stock Market Euphoria
Stock-Markets / Stock Markets 2010 Apr 15, 2010 - 11:46 AM GMTBy: Gary_Dorsch

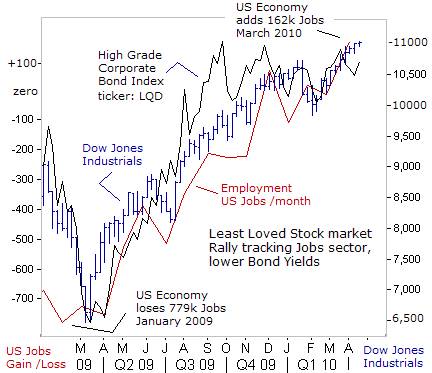
 With only the slightest degree of hesitation, the Dow Jones Industrials penetrated the psychological 11,000-level this week, extending its historic gains to +70% above its March 2009 lows, and melting away deep-seeded skepticism over whether equities have gone “too-far, too-fast,” in what is the least-loved bull market in history. Yet the bearish skeptics might want to judge the outlook for the US-economy through the lens of the stock market, rather than vice versa.
Just as the decimation of global stock markets in late 2008, erasing $30-trillion in market capitalization from the peak in October 2007 was an accurate predictor of just how severe the economic recession would be, conversely, the V-shaped recovery rally since March 2009, recouping more than $15-trillion of market value, is signaling a robust rebound in the global economy. China is the locomotive that’s pulling the global economy, leading the way at a blistering +12% clip in Q’1, 2010.
While a tsunami of money injections by the G-20 central banks initially fueled the stock markets’ historic advance, further gains must be earned the old-fashioned way, - through a solid recovery in revenues and earnings. On Wall Street, S&P-500 profits are expected to rebound +37% from a year ago, and so far, that’s looking like a conservative estimate. There’s been better-than-expected numbers by cyclical bellwethers such as CSX Railroad, Intel, UPS, and JP-Morgan, and Fed chief Ben “Bubbles” Bernanke and his band of super-doves, have reiterated that they’ll keep short-term rates locked at zero percent for an “extended period” of time.
 The Fed has its foot pressed firmly on the monetary accelerator, and driving recklessly over the speed limit, favoring faster growth over fighting inflation, in order to insure a sustainable recovery that can lead to a noticeable decline in the 9.7% jobless rate. The Fed believes it can help the economy to create new jobs, by simply printing money and stoking euphoria and speculation in the stock market.
News that US-employers added 162,000-jobs in March was one of the most encouraging signs that the Fed’s radical “quantitative easing” (QE) scheme is bearing fruit. With job creation strengthening, US-businesses have restarted to rebuild inventories from record low levels, and according to the Purchasing Manager’s Index, orders for US-exports soared to its highest level in 21-years. Retailers reported growth in sales across a broad spectrum of categories.
Behind the scenes, the Fed has kept the stock market rally intact, by funneling $1.75-trillion into the coffers of the Wall Street Oligarchs, and locking down short-term interest rates at zero-percent. Banks have funneled the Fed’s high-powered money into high-grade corporate (LQD), and junk bonds (JNK, HYG), making the stock market look more attractive. In turn, ultra-low bond yields have prevented any meaningful decline in the stock market, and fueled a parabolic V-shaped recovery. In the next phase of the rally, otherwise cautious investors typically capitulate, by returning to the equity markets, and buying stocks at marked-up prices.
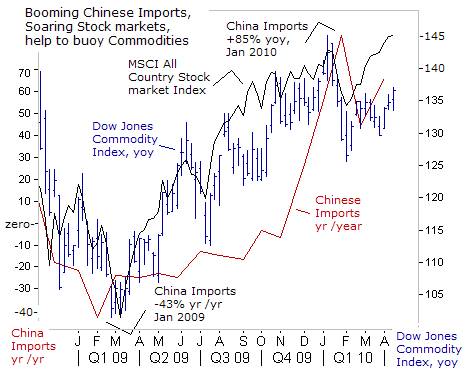
Alongside the booming stock markets, - industrial commodities are also responding to stronger economic growth in China, India, Brazil, and other emerging nations. Speculators are re-engaging the “yen carry” trade, and funding their purchases of industrial commodities at ultra-low interest rates of 0.1%, financed by Japanese brokers. China’s voracious demand for crude oil, aluminum, iron-ore, copper, and rubber, showed no let-up in March, with imports rising rapidly despite higher prices paid by factories returning to work after the long Lunar New Year holidays.
Chinese crude oil imports jumped to 5-million barrels per day in March, their second-highest monthly level on record, and 29% higher than a year ago. Imports of copper surged to 456,000-tons, up 22% from a year ago. Traders estimate that the amount of copper in Shanghai warehouses is bulging at 200,000-tons, twice February’s level. China even recorded a trade deficit of $7.2-billion in March, the first gap since April 2004, with imports surging +66% higher from a year ago.
Global crude steel production rose to 108-million tons in February, up 24% from a year earlier, with nearly half the world’s steel output emanating from China. Capacity utilization for steelmakers worldwide rose to 79.8%, a 15-month high and 12% higher than a year ago. Iron-ore, used in making steel, skyrocketed on the Chinese spot market to $167 /ton last week, nearly tripling above last year’s low. The price of DRAM computer chips in Taiwan have also tripled from a year ago.
The explosive rallies in key raw materials, utilized by factories, poses a major inflationary threat to big importers such as China and India, where food and energy account for more than half of the average household budget. So far, the central banks of China and India are still favoring faster growth, over combating inflationary pressures. India’s wholesale price index is 10% higher than a year ago, and the Bank of India is expected to hike its cash rate a quarter-point to 6% next week.
 Despite growing signs of a rebounding US-economy, and healthy profit growth for S&P-500 companies, the propaganda artists hired by the Federal Reserve, continue to paint a gloomy picture of the economy in the media. Fed officials are aiming their gloomy rhetoric at the bond market however, as part of a brainwashing operation, working to keep bond yields locked at artificially low interest rates.
“There are a lot of people who are unemployed. There are a lot of factories that are not producing at full steam, so we have excess slack. There is little inflationary pressure in the economy that is operating well below its potential,” said Dallas Fed chief Richard Fisher, on April 13th. “The pain is still with many of us to be sure, and we are a long way from a full recovery,” added Richmond Federal Reserve Bank Jeffrey Lacker. But there is no pain on Wall Street. In fact, the hallucinogenic side effects of QE have made any attempt at short-selling the stock market, as futile as trying to submerge a helium filled balloon under water.
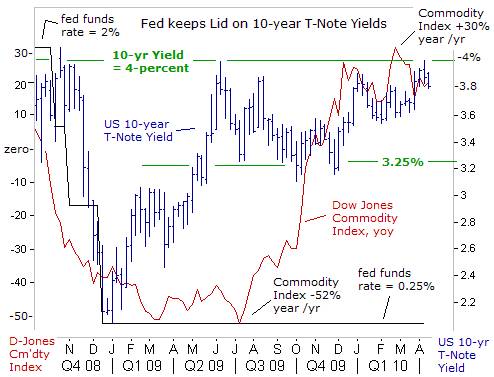
In the United States, the Dow Jones Commodity Index is hovering +20% higher than a year ago, an early warning signal that inflation will accelerate in the months ahead, regardless of what government apparatchiks say. In theory, signs of a rebounding economy, accompanied by higher commodity prices, should lead to higher Treasury bond yields. But in reality, that hasn’t been the case. Instead, the Fed has demonstrated its mastery over the Treasury bond market, by locking longer-term bond yields within narrow trading ranges, thru jawboning and stealth QE.
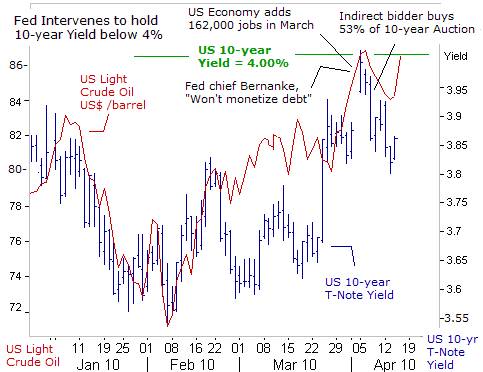
As the Dow Jones Industrials blasts thru the psychological 11,000-barrier, and the S&P-500 Index climbs through the 1,200-level, Fed officials are aware that the stock market rally could short-circuit, and fizzle-out, if Treasury yields are allowed to climb above key resistance levels. Another threat to the stock market, is a possible “Oil Shock,” as crude oil prices surged to $86/barrel this week.
Last week, when the US Treasury’s 10-year yield briefly climbed to 4-percent, a key resistance level, the Fed covertly intervened at the weekly T-note auction, disguised as an indirect bidder, to knock yields lower. Keeping a lid on the pressure cooker is essential, to keeping the euphoria on Wall Street intact. A record 4-to-1 cover at the 10-year auction, convinced short sellers in Treasury notes to scramble for cover, out of fear of the magical powers of the “Plunge Protection Team,” (PPT).
Former Fed chief “Easy” Al Greenspan warned on March 27th, that if the Fed and the Treasury want to avoid trouble in the stock market, the 10-year T-note yield should be capped at 4-percent. “If the 10-year yield begins to move aggressively above 4%, it’s a signal that we are in difficulty. There is basically this huge overhang of federal debt, - never seen before. It’s going to have a marked impact eventually unless it is contained, on long-term rates. That will make a housing recovery very difficult to implement and dampen capital investment,” he warned.
Just hours before the ten-year and thirty-year Treasury auctions, Fed chief Ben “Bubbles” Bernanke, tried to reassure skeptical foreign central banks that the US-budget deficit would not lead to higher inflation. “Inflation is not really the issue here, because the Federal Reserve is not going to monetize the government debt,” Bernanke said. China was a net seller of $61-billion of US Treasury notes over the past four-months, but cash rich buyers from the United Kingdom, picked-up the slack, purchasing nearly $125-billion during the same time period.
At the same time however, “Bubbles” Bernanke is playing a shell game, by jigging-up the stock market to sharply higher levels, with ultra-low interest rates. “The Fed has stated clearly that it anticipates that extremely low rates will be needed for an extended period,” Bernanke told the Joint Economic Committee, touching-off a wild buying frenzy on Wall Street. At the same time, primary bond dealers are loathe to lift the Treasury’s 10-year yield above 4%, without the Fed’s permission, reckoning the central bank would intervene again, to put a lid on yields.
 “If huge amounts of government borrowing push-up bond yields would the Fed then step in and buy a bundle of Treasuries just to hold rates down? I think not,” declared Dallas Fed chief Richard Fisher on March 27th. “Monetizing the debt via Fed purchases of government bonds, inevitably leads to hyperinflation and economic destruction, and the central bank will not be complicit in that action, if it were pressured to do so,” Fisher said. “The markets, fearing the consequences of runaway deficit financing, have bid-up longer-term nominal rates, resulting in a yield curve that is now historically steep. Some of this might reflect an improvement in economic growth, but we cannot turn a blind eye to the effect that growing government indebtedness has on confidence and Treasury yields,” he added.
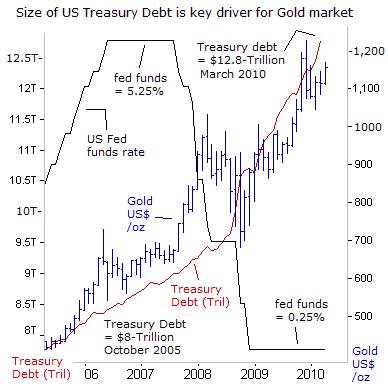
Traders have bid-up the price of gold, to as high as $1,155 /oz this week, seeing thru the haze of the Fed’s smoke and mirrors. The fact is, the Fed has already monetized trillions of dollars of new supply, through its QE scheme, and many investors have lost all faith in the anti-inflation resolve of the G-20 central banks, and ultimately, the value of paper money. In fact, the ballooning size of the US Treasury’s debt, which hit a record $12.8-trillion last month, has been a steady linchpin supporting the historic rally in the gold market over the past decade.
As a general rule of thumb, every $1-trillion of fresh debt issued by the Treasury equates with a $125 /ounce increase in the price of gold, regardless of how the Fed is manipulating the federal funds rate or bond yields. As long as the Fed and G-20 central banks continue to peg ultra-low interest rates, - and G-20 governments continue to flood the debt markets with huge quantities of IOU’s, - it translates into monetization, and the trajectory for the gold market would stay bullish.
Situated in a sweet spot, alongside booming global stock markets, and soaring prices for base metals, are the mining companies listed on the Australian Stock Exchange. Carry traders are borrowing Japanese yen, and gaining exposure to the higher yielding Australian dollar, by speculating in Australian mining and natural resources shares. Also fueling the 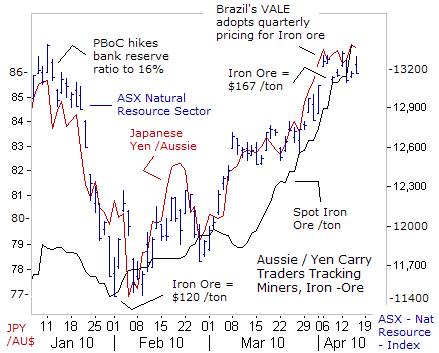 Aussie dollar’s gains from 77-yen in early February to 87-yen this week are high and rising Australian interest rates, and a surge in the spot price for iron ore, which hit $167 /ton, led by frantic Chinese steelmakers.
Recently, Vale, the Brazilian mining giant, said it negotiated a whopping 90% increase in the contract price for iron-ore, with one of its key Asian customers, Sumitomo Metal, Japan’s third-biggest steelmaker. Australian miners BHP Billiton and Rio Tinto quickly re-negotiated the terms of their iron ore sales, and moved future sales to quarterly contracts, adding to volatility on the spot market.
Global demand for iron-ore is expected to reach a record 1-billion tons this year, boosting Australia’s terms of trade, which is expected to rebound 15% this year as higher iron ore and coal spot prices are built into new export contract prices. Iron ore and coal account for nearly 40% of Australia’s exports by value, and price increases for these two commodity exports alone could add $21-billion to the local economy.
If Beijing allows the yuan to appreciate against the US-dollar, as expected, it would cut the cost of China’s imports of commodities, which totaled $244-billion in 2009. Last year, China spent 607-billion yuan ($89-billion) on importing crude oil, 343-billion yuan ($50-billion) on iron ore and 206-billion yuan ($30.2-billion) on copper. However, the Chinese ruling elite are fearful, that any revaluation would backfire, by touching off a global stampede of speculators into commodities.
This article is just the Tip of the Iceberg of what’s available in the Global Money Trends newsletter. Subscribe to the Global Money Trends newsletter, for insightful analysis and predictions of (1) top stock markets around the world, (2) Commodities such as crude oil, copper, gold, silver, and grains, (3) Foreign currencies (4) Libor interest rates and global bond markets (5) Central banker "Jawboning" and Intervention techniques that move markets.
By Gary Dorsch,
Editor, Global Money Trends newsletter
http://www.sirchartsalot.com
GMT filters important news and information into (1) bullet-point, easy to understand analysis, (2) featuring "Inter-Market Technical Analysis" that visually displays the dynamic inter-relationships between foreign currencies, commodities, interest rates and the stock markets from a dozen key countries around the world. Also included are (3) charts of key economic statistics of foreign countries that move markets.
Subscribers can also listen to bi-weekly Audio Broadcasts, with the latest news on global markets, and view our updated model portfolio 2008. To order a subscription to Global Money Trends, click on the hyperlink below, http://www.sirchartsalot.com/newsletters.php or call toll free to order, Sunday thru Thursday, 8 am to 9 pm EST, and on Friday 8 am to 5 pm, at 866-553-1007. Outside the call 561-367-1007.
Mr Dorsch worked on the trading floor of the Chicago Mercantile Exchange for nine years as the chief Financial Futures Analyst for three clearing firms, Oppenheimer Rouse Futures Inc, GH Miller and Company, and a commodity fund at the LNS Financial Group.
As a transactional broker for Charles Schwab's Global Investment Services department, Mr Dorsch handled thousands of customer trades in 45 stock exchanges around the world, including Australia, Canada, Japan, Hong Kong, the Euro zone, London, Toronto, South Africa, Mexico, and New Zealand, and Canadian oil trusts, ADR's and Exchange Traded Funds.
He wrote a weekly newsletter from 2000 thru September 2005 called, "Foreign Currency Trends" for Charles Schwab's Global Investment department, featuring inter-market technical analysis, to understand the dynamic inter-relationships between the foreign exchange, global bond and stock markets, and key industrial commodities.
Copyright © 2005-2010 SirChartsAlot, Inc. All rights reserved.
Disclaimer: SirChartsAlot.com's analysis and insights are based upon data gathered by it from various sources believed to be reliable, complete and accurate. However, no guarantee is made by SirChartsAlot.com as to the reliability, completeness and accuracy of the data so analyzed. SirChartsAlot.com is in the business of gathering information, analyzing it and disseminating the analysis for informational and educational purposes only. SirChartsAlot.com attempts to analyze trends, not make recommendations. All statements and expressions are the opinion of SirChartsAlot.com and are not meant to be investment advice or solicitation or recommendation to establish market positions. Our opinions are subject to change without notice. SirChartsAlot.com strongly advises readers to conduct thorough research relevant to decisions and verify facts from various independent sources.
Gary Dorsch Archive |
© 2005-2022 http://www.MarketOracle.co.uk - The Market Oracle is a FREE Daily Financial Markets Analysis & Forecasting online publication.