


Gold on a Tear Heading for a Test of All Time High
Commodities / Gold and Silver 2010 Apr 11, 2010 - 12:43 PM GMTBy: Merv_Burak

 It’s been a good week for gold, actually a good two and a half weeks. Gold looks to be on another tear and is heading to test December’s high. I’d give it about two weeks to get into new highs otherwise the trend may stall.
Cherry Picking
Reading an article from the www.Tampabay.com site (a St. Petersburg Times (Florida) site) linked from the www.kitco.com web site gave one a perfect example of cherry picking your information. Although the article “Financial advisers warn gold may be at a bubble level” tried to be somewhat neutral giving both sides of the story it came across as basically a hit job on gold by cherry picking the time periods to emphasize the information. Let’s just look at two of the pieces of information presented; “---since 1980, the S&P 500 has outperformed gold by a 10-to-1 ratio.” and “Since the stock market bottomed a year ago, the S&P 500 Index has risen nearly 70 percent, compared with a 22 percent increase in the price of gold.”
Let’s look at the first period mentioned. 1980 was a good pick for the market. That’s just about when the huge bull market started after 20 years of doing nothing. That is also just about when gold topped out at $875 after a multi year run-up from the $38 level (over a 2000% gain, a gain for gold of 20-to-1 versus the S&P or Dow for that multi year period).
The second example is also misleading. Picking the bottom of the S&P Index looks good but gold bottomed out several months earlier. If we used the bottom of the gold price in late 2008 we get a gold performance of 61% versus an S&P performance of only 15%, but of course that wouldn’t go with the story.
Picky, picky.
On the other hand who buys stock, closes their eyes and mind and holds on for dear life for 20 or 30 years? I don’t think even the highest quality General Motors investors are doing so these days.
Picky, picky.
GOLD
LONG TERM
The move towards new all time highs continues, only about 6% left to go. The long term P&F chart shows no sign of any reversal of trend although a move to the $1080 mark would do so. That’s only 8% below the present level. A tight range for a long term market trend.
As for the usual indicators, everything, as could be expected, is in the positive side. Gold is above its positive trending moving average line. The momentum indicator remains in its positive zone above a positive trigger line. The volume indicator is moving higher above its positive trigger line. The long term rating remains BULLISH.
INTERMEDIATE TERM
On the intermediate term everything here is positive also. Gold is above its positive sloping moving average line. The momentum indicator continues to move higher inside its positive zone and above its positive trigger line. The volume indicator remains above its positive trigger line but is not as strong as I would like to see it. Usually the volume indicator should be leading the price but that does not seem to be happening. Anyway, the intermediate term rating remains BULLISH. The short term moving average line continues to move higher above the intermediate term line for continuing confirmation of the bull.
SHORT TERM
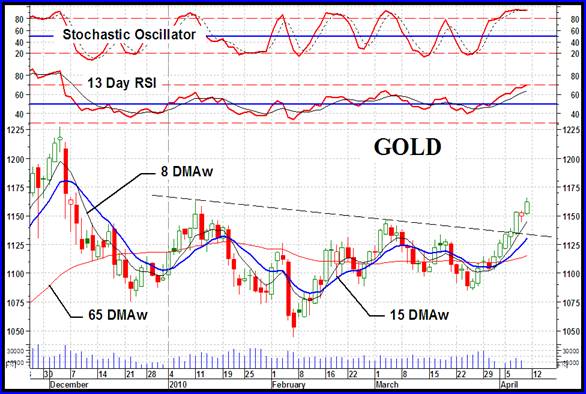
Short term wise it was a pretty good week. Gold broke through that short term head and shoulder pattern neckline and seems to be headed back to test the previous high. One should be quite joyful but the nagging pain in my head seems to be cautioning me that things just look too good. The trend and moving averages are okay but the momentum and volume indicators are not what one would like. The short term momentum indicator is gang-busters on the up side and higher than it’s been since early Dec. But that’s the problem here. The momentum indicator is just about to enter its overbought zone, short term wise, and one may expect a short term hesitation or reversal any time now. The daily volume action is very weak and not telling us that the speculators are REALLY in the game. This may still be a left over from the Easter holiday so I’ll be interested as to how the daily volume might improve this coming week. With that caution have been said the indicators are still very positive and the short term rating remains BULLISH at this time. The very short term moving average line continues to confirm this bull by remaining above the short term line.
As for the immediate direction of least resistance, well one might be foolish to go against such a strong prevailing trend but I will be a little cautious here. The aggressive Stochastic Oscillator is in its overbought zone and has flattened out in a turning operation. It has not yet moved below its overbought line but that may come on one day of downside activity. Although the SO has turned all the way to the horizontal it also has not yet quite crossed below its trigger. So, although there is no reversal warning yet things are heading in that direction. In the mean time I will go with a basic lateral direction as the direction of least resistance for now.
SILVER
From its high in Dec to its low in Feb silver declined 24.8% while gold declined only 14.9%. From the low in Feb to Friday’s close silver advanced 25.3% while gold advanced only 11.2%. So, what do we learn from this simple comparison? For one they both might move in the same direction but each moves to a different scale. Silver seems to be twice as volatile as gold, both on the up side and the down side. Does this indicate that once the down side starts one should get out of silver fast and once the up side starts one should quickly jump on the silver band wagon? Well, something like that but one must go a little further in ones look-see.
When talking about stocks there is a world of difference between the “quality” stocks and the more speculative ones. Looking at the RS ratings in the Table below the intermediate term covers a little more than the period from the Feb bottom to the present. The Merv’s Qual-Gold Index is rated stronger than the Merv’s Qual-Silver Index for this period (note that the lower the RS number the stronger the performance for the period). However, on the speculative side the Merv’s Spec-Silver Index has a far superior performance than does the Merv’s Spec-Gold Index for the same period. This difference in performance between the speculative stocks and the quality stocks hold true for the short term, which covers the recent three week rally.
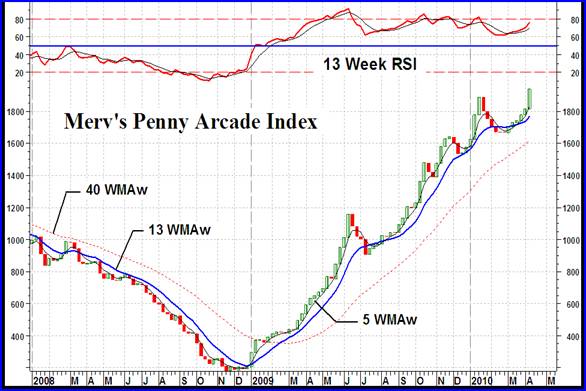
Looking at the Indices chart we see that the Qual-Gold and Qual-Silver have still not moved into new recovery highs while the Spec-Gold and Spec-Silver are well into new highs. Even more so, the Spec-Silver is into new all time highs as is the Merv’s Penny Arcade Index of penny stocks.
Simply put, if one were interested in speculating in silver stocks, which are at present giving the better performance versus gold stocks, then one should not be looking at the top quality silver issues but the more speculative ones. THAT’S where the performance is.
PRECIOUS METAL STOCKS
All gold and silver Indices had a good week but there is a significant difference in there performances. All of the major North American Indices are still some distance from their respective Dec/Jan highs, least of all from their previous 2008 highs. As for the Merv’s Indices MOST are already into new all time high territory, except for the following: the Merv’s Qual-Gold Index is still slightly below its Jan high and only about 2% below its all time high, the Merv’s Gamb-Gold Index is well above its Jan high but just shy of its all time high and the Merv’s Qual-Silver Index is considerably below its Jan high and only about half way towards its all time 2008 high. As for the pennies, well the Merv’s Penny Arcade Index is roaring into new all time high territory 44% above its previous bull market high which topped out in 2007. It is also 970% above its Nov 2008 low. As I have been mentioning for some time now, as long as these pennies keep on moving higher then we have no real concern for the overall gold and silver stocks topping out. The more speculative or gambling stocks are noted to top out long before the rest of the market.
Merv’s Precious Metals Indices Table
Well, that will be it for this week.
By Merv Burak, CMT
Hudson Aero/Systems Inc.
Technical Information Group
for Merv's Precious Metals Central
For DAILY Uranium stock commentary and WEEKLY Uranium market update check out my new Technically Uranium with Merv blog at http://techuranium.blogspot.com .
During the day Merv practices his engineering profession as a Consulting Aerospace Engineer. Once the sun goes down and night descends upon the earth Merv dons his other hat as a Chartered Market Technician ( CMT ) and tries to decipher what's going on in the securities markets. As an underground surveyor in the gold mines of Canada 's Northwest Territories in his youth, Merv has a soft spot for the gold industry and has developed several Gold Indices reflecting different aspects of the industry. As a basically lazy individual Merv's driving focus is to KEEP IT SIMPLE .
To find out more about Merv's various Gold Indices and component stocks, please visit http://preciousmetalscentral.com . There you will find samples of the Indices and their component stocks plus other publications of interest to gold investors.
Before you invest, Always check your market timing with a Qualified Professional Market Technician
Merv Burak Archive |
© 2005-2022 http://www.MarketOracle.co.uk - The Market Oracle is a FREE Daily Financial Markets Analysis & Forecasting online publication.