


U.S. Friday Jobs Report
Economics / US Economy Apr 04, 2010 - 06:09 AM GMTBy: PhilStockWorld

 Most markets are closed Friday. Japan was open and they went up 41 points (0.37%) and the MSCI Asia Pacific Index also went up 0.3% in Tokyo 1trading and Russia fell 0.1% but markets in Australia, Hong Kong, China, New Zealand, Singapore, India, the Philippines, Indonesia, the U.S. and all of western Europe are closed today for holidays. Strangely though, the Futures Market is open this morning so that can make things very tricky on a big data day like today.
The MSCI Asia Pacific Index has gained 1.7 percent this week as growth in China’s manufacturing and an increase in U.S. consumer spending bolstered optimism the global economic recovery is gaining momentum. The index this week completed its fourth consecutive quarterly advance with a 3.9 percent increase in the three months through March 31. Shares in the gauge trade at 16.4 times estimated earnings, compared with 14.8 times for the MSCI World Index of 23 developed nations. “The global macroeconomic recovery is behind the current uptrend in equities,” said Tomomi Yamashita, of $3.8Bn Shinkin Asset Management. “That trend is unlikely to change though the market is getting overheated.”
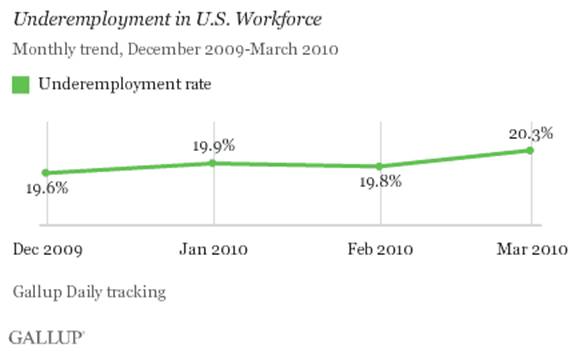
We get Non-Farm Payrolls at 8:30 and, obviously, investors are expecting a report that shows the US firmly on the road to recovery but I have already been reading a Gallup poll on Underemployment that suggests otherwise. According to the March tracking poll, 20.3% of the US workforce was UNDERemployed and that is UP 0.5% from February. . Gallup classifies respondents as underemployed if they are unemployed or working part-time but wanting full-time work. Gallup employment data are not seasonally adjusted.
Those underemployed people are mainly counted as employed in the NFP report and are a major distortion of the numbers, especially as the main delta component was a huge rise in part-time workers, from 9.2% to 9.9% and, like temps, they tend to be counted by the government as happy, happy workers. Unemployment (no job at all) measured by Gallup decreased from 10.6% to 10.4% and you can see from the following chart how those two are related:
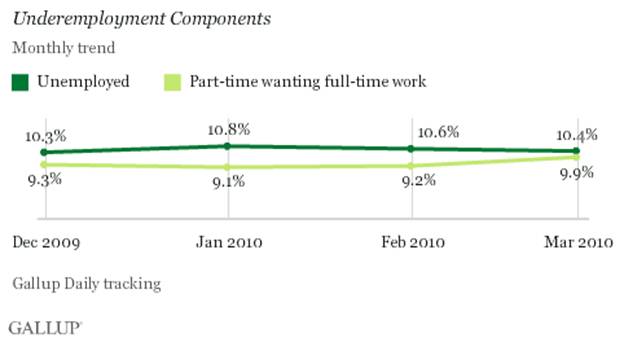
According to Gallup, as unemployed Americans find part-time, temporary, and seasonal work, the official unemployment rate could decline. However, this does not necessarily mean more Americans are working at their desired capacity. It will continue to be important to track underemployment — to shed light on the true state of the U.S. workforce, and the millions of Americans who are searching for full-time employment.
Since it’s a holiday, I will present to you this gigantic chart that Barry Ritholtz found on Mint.com, which gives us a really good look at the US work force:
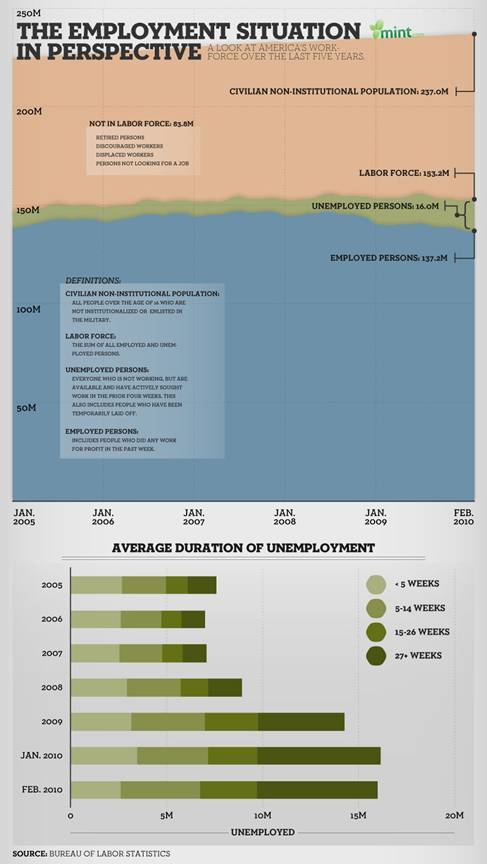
Notice the key component here is the total decline in Employed people, millions less than were employed in 2005, which indicates we have flushed a half a decade of growth down the tubes and lost ground. We know wages haven’t been going up and, in fact, the average family makes far less than they did in 2005 and, of course, Trillions of dollars worth of household wealth has been destroyed since 2005 and people are far more in debt than they were in 2005. Why then, is are the Dow and S&P 10% higher than they were in 2005?
If you haven’t done so already, this is a very good day to read my "2010 Outlook - A Tale of Two Economies," which is pretty much the situation we see unfolding so far in Q1 as the US consumer is still on the ropes but companies that service the top 10% like TIF, COH and SKS are having fantastic years as the top 10% are raking it in with 2009’s huge stock market gains, the return of Wall Street bonuses and, of course, all those benefits we get from mass layoffs that allow us to pay our workers lower wages and less benefits in return for the expectation of higher productivity. That can make up a 10% decrease in consumer buying power since 2005 but what about next quarter? Where is the growth going to come from?

Well it better come from jobs and now I’ve rambled long enough that it’s 8:30 and we have added 162,000 jobs, which is much lower than expected (GS lowered their forecast from 275,000 to 200,000 just yesterday) but that isn’t stopping the futures from acting like something great just happened and their immediate reaction is to push higher. 48,000 of those jobs were census workers - a 6-month temp job at best with 121,000 jobs added in the low paying Service Industry and just 17,000 Manufacturing jobs. Unemployment, as tabulated by the government, is just 9.7%, which is flat to last Month and well below Gallup’s not-so-fluffy 10.4% number.
Here’s a couple of fun facts from the report: The number of long-term unemployed (those jobless for 27 weeks and over) increased by 414,000 over the month to 6.5 million, reversing the improvement trend in the bar lines on the big chart above. In March, 44.1 percent of unemployed persons were jobless for 27 weeks or more. (See table A-12.) Isn’t that great?? The futures sure seem to think so, as the Dow jumped 50 points on that news. The number of persons working part time for economic reasons (referred to by the government as "involuntary part-time workers") increased by 263,000 to 9.1 million in March. These individuals were working part time because their hours had been cut back or because they were unable to find a full-time job. (See table A-8.)
About 2.3 million persons were marginally attached to the labor force in March, compared with 2.1 million a year earlier. (The data are not seasonally adjusted.) These individuals were not in the labor force, wanted and were available for work, and had looked for a job sometime in the prior 12 months. They were not counted as unemployed because they had not searched for work in the 4 weeks preceding the survey. (See table A-16.) Among the marginally attached, there were 1.0 million discouraged workers in March, up by 309,000 from a year earlier. Discouraged workers are persons not currently looking for work because they believe no jobs are available for them. U6 Unemployment, the broadest measure, rose to 16.9% – that’s off of the December 2009 peak of 17.3, but higher than January (16.5%) and February (16.8%) of 2010.

40,000 of our 162,000 jobs added were temp jobs, temps have added 313,000 jobs since September - far more than our total gains in employment. Over the month, employment changed little in transportation and warehousing, leisure and hospitality, retail trade, and wholesale trade. In March, financial activities shed 21,000 jobs, with the largest losses occurring in insurance carriers and related activities (-9,000). Employment in the information industry decreased by 12,000. I find this very interesting in light of our recent Sector Review where these growthless parts of the market are up about 10% since February.
And, of course, the cherry on top of this report - the item that adds huge insult to the tremendous injuries done to the American workers is that, in March, average hourly earnings for the 137M people who do have jobs fell by 0.1% and 0.1% of 137M is the equivalent of 137,000 jobs lost in the form of less money paid to the existing workers - another huge win for productivity! Yay top 10%!!!!
THAT’s how the markets go up on a tepid report like this. Continuing high unemployment and low wages allow the top 10% to squeeze another big quarter of productivity out of the bottom 90% and that should kick right up the line to give us some pretty good Q1 earnings. Not only that, but the lack of actual jobs will keep the Fed in free money mode - giving more and more loans at ultra-low interest rates - subsidized by the American people -to the companies that arent’ hiring them! Ah capitalism, you beautiful, efficient son of a *****!
Have a Happy Easter!
By Phil
Philip R. Davis is a founder of Phil's Stock World (www.philstockworld.com), a stock and options trading site that teaches the art of options trading to newcomers and devises advanced strategies for expert traders. Mr. Davis is a serial entrepreneur, having founded software company Accu-Title, a real estate title insurance software solution, and is also the President of the Delphi Consulting Corp., an M&A consulting firm that helps large and small companies obtain funding and close deals. He was also the founder of Accu-Search, a property data corporation that was sold to DataTrace in 2004 and Personality Plus, a precursor to eHarmony.com. Phil was a former editor of a UMass/Amherst humor magazine and it shows in his writing -- which is filled with colorful commentary along with very specific ideas on stock option purchases (Phil rarely holds actual stocks). Visit: Phil's Stock World (www.philstockworld.com)
© 2010 Copyright PhilStockWorld - All Rights Reserved Disclaimer: The above is a matter of opinion provided for general information purposes only and is not intended as investment advice. Information and analysis above are derived from sources and utilising methods believed to be reliable, but we cannot accept responsibility for any losses you may incur as a result of this analysis. Individuals should consult with their personal financial advisors.
© 2005-2022 http://www.MarketOracle.co.uk - The Market Oracle is a FREE Daily Financial Markets Analysis & Forecasting online publication.