


Euro, U.S. Dollar and Crude Oil: Oil is the Winner Hands Down
Commodities / Crude Oil Mar 21, 2010 - 12:46 PM GMTBy: Fresbee

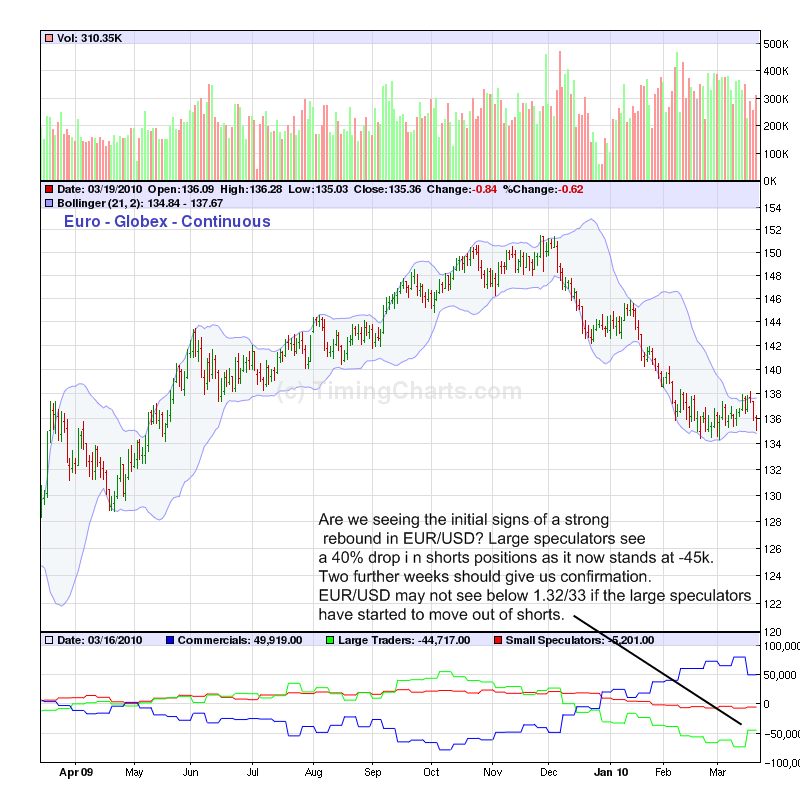
 Euro saw 40% reduction in open interest as large speculators decided to take some of their profits off the table. What was surprising was the amount by which the open interest reduced wwhich was the largest in recorded history.
Is there a possibility that we are now in the final leg of the EURO down turn? The large speculators were dead accurate when they started to reduce their long position in November first week and 30 days later we saw the EUR/USD crack down a massive 1000 pips in 60 days flat.
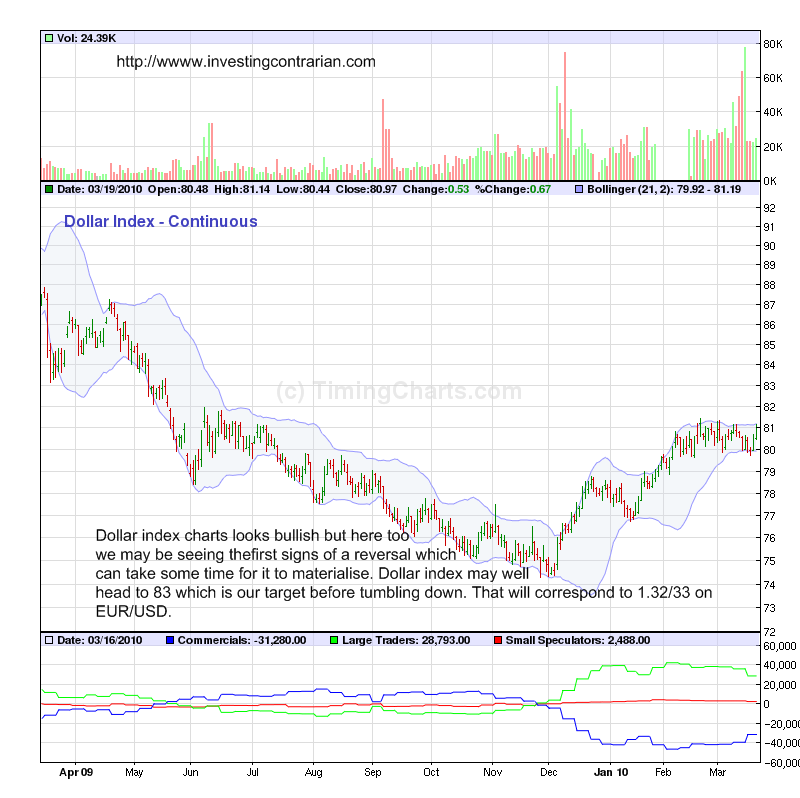
Dollar Index looks bullish but the large speculators have started to get tired of the rally and moving out. In my view there is one last leg left for the dollar to hit 82.5/83 before resuming its trend down.
That brings me to my favoritye commodity for 2010. Oil!!
We are quite literally staring at Gold that is Black. $100 is on the cards here. Large and massive positions have been built over the last few months even through all the stock market volatility.
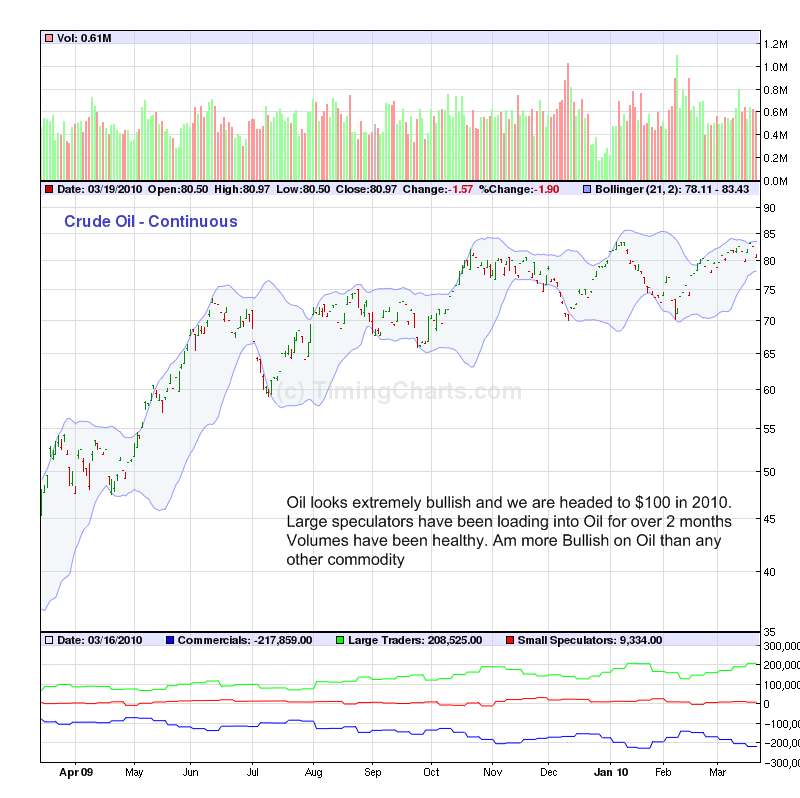
Looking at this chart it almost seems that insiders are sensing something massive like a war or Israel Iran standoff all of which could spike Oil faster than you can count the ticks.
Earlier today we posted the Oil looks all set for $100
Reproduced here and originally written by Darrly Guppy:
In July 2008 when oil was trading near $146 a barrel many companies used futures and hedging contracts to lock-in prices near $146. A few weeks later oil started its plunge to the eventual low of $33. The collapse was a high probability outcome of the parabolic trend that started to develop in May 2007. This type of trend usually leads to a rapid collapse, although the eventual fall in oil was much lower than expected.
The same type of parabolic trend is found in the current gold chart. The fall from $1,200 to $1,055 was consistent with the type of collapse associated with a parabolic trend, although the gold price retreat has not been as dramatic as the retreat in oil during 2008.
Price activity is a reflection of human behavior. This behavior may be driven by objective and verifiable factors, such as the supply and demand balance for oil. However, the behavior is modified by a wide range of emotional factors. These are often classified broadly into fear and greed but this is an oversimplification. Behavior is complex, and behavior when money is involved is even more complex. Fortunately behavior shows repeated responses and these are revealed as repeated patterns of price behavior in the market.
The parabolic trend is a result of a particular grouping of emotional behaviors. The current behavior seen on the chart of NYMEX oil does not include a parabolic trend but it does include patterns that provide a guide to the emotional thinking of the market. Better price chart analysis helps understand the status of the commodity and its economics, and the status of the market for the commodity. It suggests there is increased probability oil will move towards $100 during 2010.
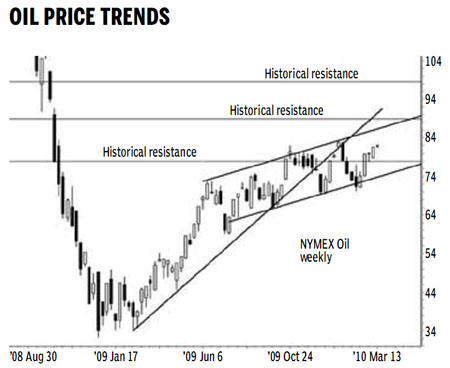
The weekly NYMEX oil chart shows an uptrend that has paused but this has not developed into a downtrend. The pause is defined by an up-sloping wide trading channel. The chart has several bullish features and they suggest markets are moving towards higher oil prices.
The first important feature is the long-term uptrend line starting from the low in February, 2009. From then to October last year the uptrend line acts as a support level. In December, 2009, the price dropped below the uptrend line. This price fall signaled a change in the nature of the uptrend line from a support feature to a resistance feature.
Starting December 2009, the uptrend line acts as a resistance level. The price rise in January 2010 to $83 retreats from the value of the uptrend line. The uptrend line is now the resistance level. This line defines the general behavior of the long-term trend.
The second important feature is the up-sloping trading channel. The upper edge of the trading channel starts from the high at $73 in June, 2009. The line touches the highs of $80 and $83. This is a resistance level. The lower edge of the trading channel starts from near $65 in July 2009. This line touches the lows in $66 and $69 and $71.
The third important feature is the strong historical resistance level near $88. This is the mid-year upside target for oil. The bullish environment for oil is confirmed when the oil price retreats to the historical support level near $78 and uses this for a rebound rally. This is a very bullish signal and will allow prices to move very quickly towards $88 or higher. A sustained move above $88 has an upside target near $98. The current rate of trading band momentum makes this target achievable towards the end of 2010.
The longer-term outlook for oil suggests increasing prices but the rate of increase is slower than the rate of increase in 2009.
Oil looks all dressed up. Lets see if it can take down the all important $88 and then $100.
Source : http://investingcontrarian.com/global/euro-dollar-and-oil-oil-is-the-winner-hands-down/
Fresbee
http://investingcontrarian.com/
Fresbee is Editor at Investing Contrarian. He has over 5 year experience working with a leading Hedge fund and Private Equity fund based out of Zurich. He now writes for Investing Contrarian analyzing the emerging new world order.
© 2010 Copyright Fresbee - All Rights Reserved
Disclaimer: The above is a matter of opinion provided for general information purposes only and is not intended as investment advice. Information and analysis above are derived from sources and utilising methods believed to be reliable, but we cannot accept responsibility for any losses you may incur as a result of this analysis. Individuals should consult with their personal financial advisors.
© 2005-2022 http://www.MarketOracle.co.uk - The Market Oracle is a FREE Daily Financial Markets Analysis & Forecasting online publication.