The Climax of the Stock Market Broadening Top
Stock-Markets / Stock Markets 2010 Mar 16, 2010 - 12:28 PM GMT

 The picture above is a basic outline of the broadening top formation as described by John J. Murphy in his book, “Technical Analysis of the Futures Markets,”(pp. 150-152) published in 1986.
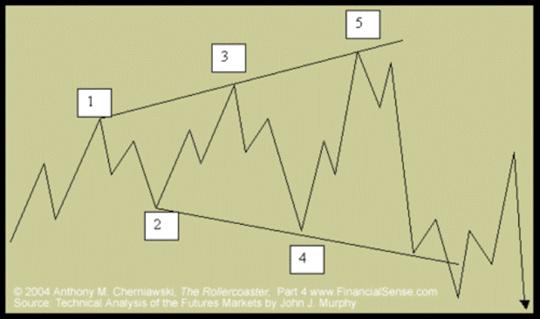
He summarizes, “First of all, the broadening formation is a relatively rare pattern. When it does appear, however, it’s usually at an important market top. It looks like an expanding triangle with three successively higher peaks and two declining troughs. The wider price swings are accompanied by gradually increased trading activity. The resolution of the formation is signaled by the violation of the second low (point 4) after the completion of the third peak (point 5).”
While John compares the broadening formation as a triangle in reverse, I would like to compare it as the inverse of an ending diagonal or wedge formation. While some broadening formations have a horizontal axis, many have a diagonal axis and fall in the same category. It is the opposite of a diagonal pattern where volume diminishes as the pattern develops. In this case, the volume tends to expand with each price swing, giving the appearance of market support for each breakout. Traders get the surprise of their lives when the market promptly reverses in the other direction. John Murphy says, “This situation represents a market that is out of control and unusually emotional.”
Let’s look at the major indices to see how this pattern has developed.
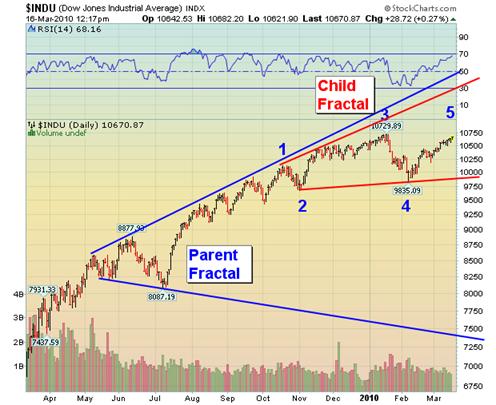
What may come as a surprise to many, there are two probable broadening formations in the Industrials. I call them the parent fractal and the child fractal, an extension of the parent. The numbers are meant to correspond with the pivots points on the broadening formation, but could also be interpreted as Elliott Wave labels as well. If the Elliot Wave rules apply, we are given a natural limit on point (wave) 5 of 10,881. Currently, point 5 is lower than point 3 and may not be required to exceed it. This would be considered a truncation and may increase the probability for a bearish outcome.
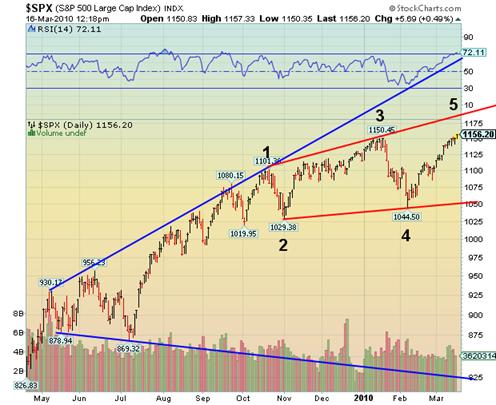
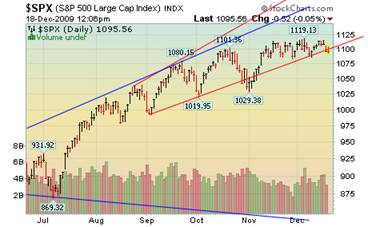
The SPX shows a similar profile as the INDU. Although point 5 has not reached the upper trendline, it has exceeded point 3, which implies that completion is very near. Applying the Elliott Wave Principles, the natural top for point (wave) 5 may not exceed 1165.
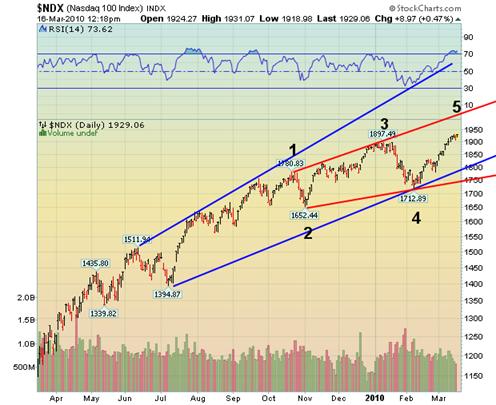
The NDX reminds me of a reverse-engineered ending diagonal. Both the parent and child fractals have a diagonal tilt that adds credence that the end may be near. Again, the Elliott Wave Principles suggest that point 5 may not exceed 1957.00. If this is so, then a reversal may be imminent.
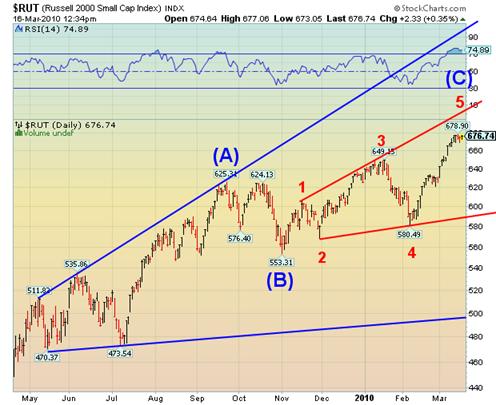
Finally, the Russell 2000, the index which is most loved by speculators, is also nearing completion. It has a natural target of 705.00, based on guidelines for zig-zag waves. There is no assurance that this target will be met.
As a further note, the Russell 2000 has rallied 98% from its 2009 low. The NDX rallied 85.7% from its low last March. The S&P 500 rallied 73.5% and the Industrials rallied 65.8%. This indicates that the participation by all investors has been robust. Since the broadening formation indicates an unusual amount of public participation, it could now be said that the average investor is “all in.”
Many analysts will agree with John Murphy’s comment that, “This situation represents a market that is out of control and unusually emotional.” In fact, I have been told, “There is something wrong with this market” a number of times by other traders. The final climax of point 5 may mark the end of this phase of “irrational exuberance” by many investors.
Traders alert: The Practical Investor is currently offering the daily Inner Circle Newsletter to new subscribers. Contact us at tpi@thepracticalinvestor.com for a free sample newsletter and subscription information.
Our Investment Advisor Registration is on the Web
We are in the process of updating our website at www.thepracticalinvestor.com to have more information on our services. Log on and click on Advisor Registration to get more details.
If you are a client or wish to become one, please make an appointment to discuss our investment strategies by calling Connie or Tony at (517) 699-1554, ext 10 or 11. Or e-mail us at tpi@thepracticalinvestor.com .
Anthony M. Cherniawski,
President and CIO
http://www.thepracticalinvestor.com
As a State Registered Investment Advisor, The Practical Investor (TPI) manages private client investment portfolios using a proprietary investment strategy created by Chief Investment Officer Tony Cherniawski. Throughout 2000-01, when many investors felt the pain of double digit market losses, TPI successfully navigated the choppy investment waters, creating a profit for our private investment clients. With a focus on preserving assets and capitalizing on opportunities, TPI clients benefited greatly from the TPI strategies, allowing them to stay on track with their life goals
Disclaimer: The content in this article is written for educational and informational purposes only. There is no offer or recommendation to buy or sell any security and no information contained here should be interpreted or construed as investment advice. Do you own due diligence as the information in this article is the opinion of Anthony M. Cherniawski and subject to change without notice.
Anthony M. Cherniawski Archive |
© 2005-2022 http://www.MarketOracle.co.uk - The Market Oracle is a FREE Daily Financial Markets Analysis & Forecasting online publication.