


Stock Market Constructive Pullback Could Create Buying Opportunities
Stock-Markets / Stock Markets 2010 Mar 16, 2010 - 01:39 AM GMTBy: David_Grandey

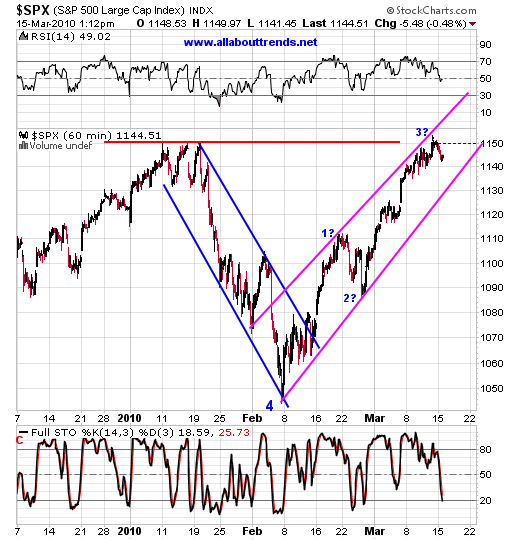
 The S&P 500 hit resistance at 1150 last week and is now pulling back. It's all about the trend channels at this point.
Bottom line this overbought condition when viewing the 60 minute charts gets worked off by either going sideways or a pullback to trend channel support.
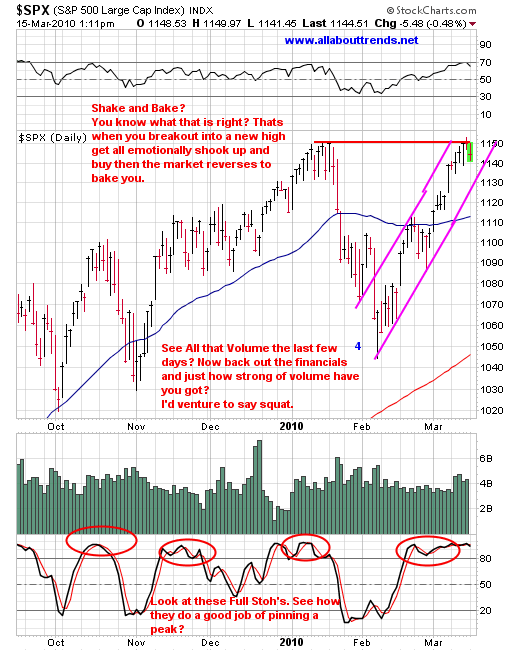
See the S&P 500 during January? It went sideways range bound. Don't rule that out over the next week or so.
Well as you can see we are starting to work our way towards the trend channel support line. We'll either do that sideways till we catch it or down to it. Thus far the action seems corrective vs. impulsive.
Market Leaders
Some MAY be topping right here. It doesn't take a rocket scientist to see all having that "Look". This automatically doesn't mean that it's all downhill from here it just means that they are pulling back. I'm sure some will bite the dust in this pullback but at this moment in time it's something you want to be aware of.
The names below are probably not good ideas to be a buyer of at this moment in time. A lot of these names could easily just pullback to the 50 day average. If you are long only or looking to gain some long exposure then you need to see some sort of Pull back Off Highs (POH) pattern form from here over the next few days at least. That's what we'd be looking for anyway.
The Pullback Off Highs pattern is one of the most bullish and constructive longside set-ups out there. Rather than go straight up, an index or stock will make a move higher, then spend sometime consolidating those gains often down to an area of chart support such as its 50-day moving average, before making another move into new high ground.
When a stock clears these consolidation periods, it's your opportunity to buy them and take advantage of the next run -- and the bonus part is when you catch a stock at the beginning of a new uptrend, you'll often get to trade the stock and lock in profits over and over again. You are buying it at the point where it's just started a new move and is near support which minimizes your risk.
On the flip side, a Double Top we is your early warning alert pattern letting you know in advance that a "Change In Trend" may be near. Here’s charts from a few of the market leaders:
The names below are probably not good ideas to be a buyer of at this moment in time. A lot of these names could easily just pullback to the 50 day average. If you are long only or looking to gain some long exposure then you need to see some sort of Pull back Off Highs (POH) pattern form from here over the next few days at least. That's what we'd be looking for anyway.
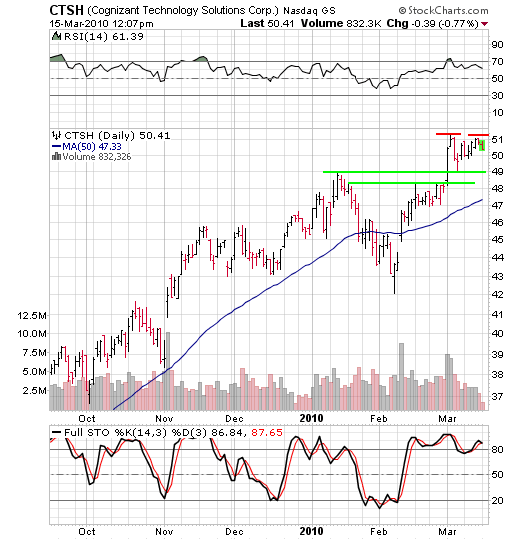
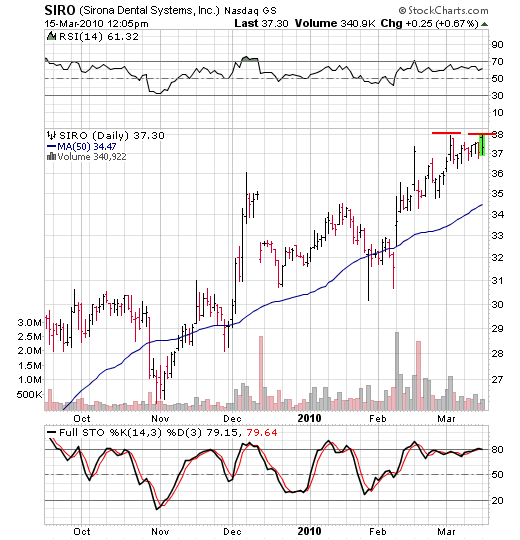
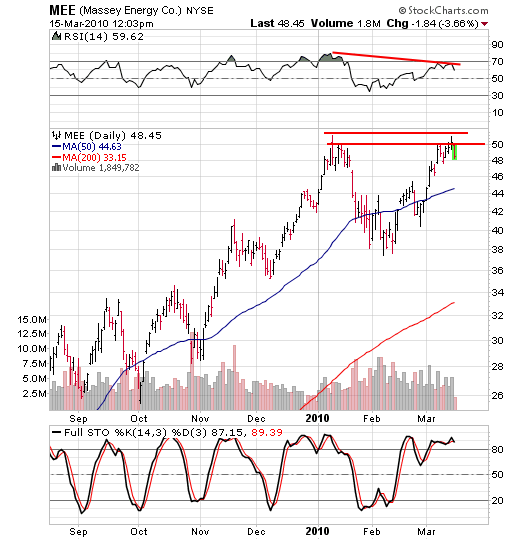
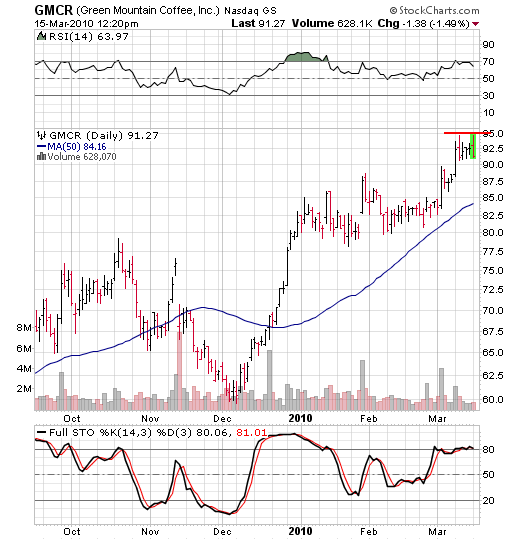
If you are long the market, you’ll want to see these leaders pullback from here and form a constructive Pullback Off Highs pattern allowing you to enter them at a risk adverse entry point. So far, the pullback in the markets is constructive and that bodes well.
By David Grandey
www.allabouttrends.net
To learn more, sign up for our free newsletter and receive our free report -- "How To Outperform 90% Of Wall Street With Just $500 A Week."
David Grandey is the founder of All About Trends, an email newsletter service revealing stocks in ideal set-ups offering potential significant short-term gains. A successful canslim-based stock market investor for the past 10 years, he has worked for Meriwest Credit Union Silicon Valley Bank, helping to establish brand awareness and credibility through feature editorial coverage in leading national and local news media.
© 2010 Copyright David Grandey- All Rights Reserved Disclaimer: The above is a matter of opinion provided for general information purposes only and is not intended as investment advice. Information and analysis above are derived from sources and utilising methods believed to be reliable, but we cannot accept responsibility for any losses you may incur as a result of this analysis. Individuals should consult with their personal financial advisors.
© 2005-2022 http://www.MarketOracle.co.uk - The Market Oracle is a FREE Daily Financial Markets Analysis & Forecasting online publication.