


Gold Tumbles Into Short-term Bearish Trend, Long-term Still Bullish
Commodities / Gold and Silver 2010 Mar 14, 2010 - 06:01 AM GMTBy: Merv_Burak

 It’s been a bummer of a week but all is not lost yet. Markets go up, down and sideways. This seems to be one of those intermediate term sideway periods with short term ups and downs.
GOLD LONG TERM
The previous week my long term P&F chart broke into a new bull market trend. This past week the direction of the P&F plot turned to the down side. A quick check, however, shows that we are a long way from reversing back to a P&F bear trend. At this time, assuming a straight down move, it would take a move to $1035 to go into a bear trend. So, from the P&F standpoint, this past week is just a normal reaction that happens during any trend.
As for the normal indicators, the price of gold remains above its positive sloping long term moving average line. The moving average is presently at the $1080 level and the two are closing rapidly. We’ll have to keep watch to see if the price will cross below the line. It did so in early Feb but the line slope remained positive and the price quickly moved back above the line. The long term momentum indicator is still in the positive zone but has already dropped below its trigger line and the trigger has now turned downward. The volume indicator is also showing weakness and has dropped below its trigger line. The trigger here is also in a negative slope. Although there are signs of the long term weakening, at the present time the rating remains BULLISH.
INTERMEDIATE TERM
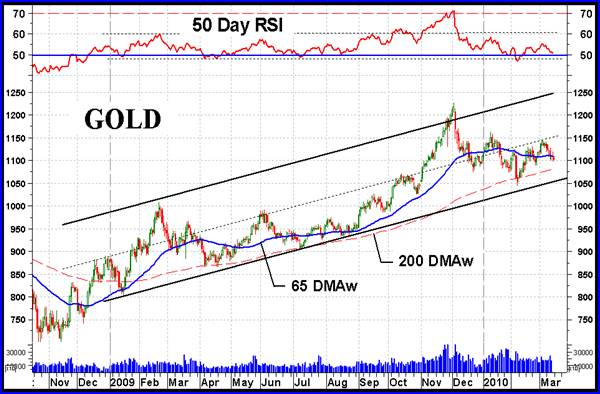
Since starting a new bull move in late 2008 gold has basically stayed inside an up trending channel with only very brief periods outside the channel. Drawing a mid point channel line (dotted line) it’s interesting to note that 80% to 90% of the action has been in the lower half of the channel. What this means, if anything, I’m not sure. Technicians like to look at charts and try to see meaningful things in them all the time. I’m no different but as mentioned, at this time I’m not sure if I’m seeing anything special or not. It may be interesting to note that when we have a prolonged channel such as this it is usual to see the action split about 50/50 between the upper half and the lower half. Maybe this suggests that in the future the action location may change more into the upper half of the channel. Just wondering.
The other interesting feature in the chart is the 50 day RSI, my intermediate term momentum indicator. Every time the momentum dropped slightly below the 50% mark we had a rally. The latest move below the 50% level was more severe than before and so far we have not had the rally one would have hoped for, but it’s still early and may yet come.
Going to the usual indicators, the price of gold once more dropped below its moving average line and the line has turned downward. The momentum indicator is still slightly in the positive zone but moving lower and is below its negative trigger line. The volume indicator is below its negative trigger line. The intermediate term rating has slipped into the BEARISH camp.
SHORT TERM
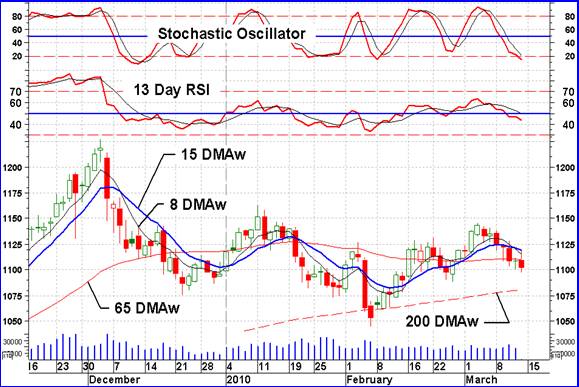
After the action this past week it should be no surprise that all the short term indicators have seen better days. Gold is below its short term moving average line and the line is sloping downward. The momentum indicator has entered its negative zone and is below its negative trigger line. The daily volume action is what one would expect, slight improvement on the up side (Thursday) but mostly weak as the price moves lower. All in all, the short term rating can only be BEARISH.
As for the immediate direction of least resistance, there the view is somewhat mixed. Although gold remains below its very short term moving average line and the Stochastic Oscillator is deep inside its negative zone one senses a possible turn for the price. The Stochastic has entered its oversold zone from where rallies occur, but when is the question. A rally does not start immediately after the SO enters its overbought zone. We should wait for the SO to turn around and move above its oversold line before jumping to conclusions. For now I will go with the lateral trend as the best possibility for the next day or two.
SILVER
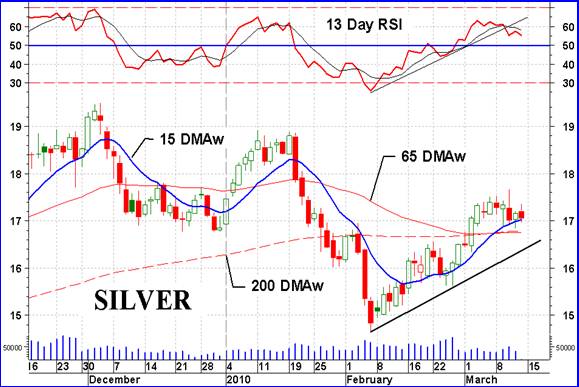
Despite a 1.9% decline this week silver is still acting better than gold lately. The short term performance in the Table suggests this. Its short term Relative Strength (RS) is not only better than gold but its strength is still on the upswing while gold’s RS is already in the decline. A look comparing the two charts would also suggest this difference. Although not drawn, a short term trend line in gold was broken this past week while silver is still above its trend line. Silver is also still trading above all of its positive sloping moving average lines. Unfortunately, having said all that, now the bad news. The short term momentum indicator is showing weakness and suggesting a decline is ahead. It has crossed below its short term trend line which I find more accurate than the price trend line, or at least an earlier warning line. The momentum is also below its already negative sloping trigger line so we just might expect some negative action over the next few days. The Stochastic Oscillator (not shown) is in a decline and inside its negative zone although not yet inside its oversold zone.
PRECIOUS METAL STOCKS
The vast majority of Gold and Silver Indices showed declines this past week. About the only ones showing an advance were those representing the more aggressive stocks. The Merv’s Gamb-Gold, Spec-Silver and Penny Arcade along with the universe Merv’s Gold and Silver 160 Indices were on the up side. Gamblers are not giving up on these stocks just yet, which is good news for the overall precious metals market as these gamblers seem to be the first to give up ahead of the other groups.
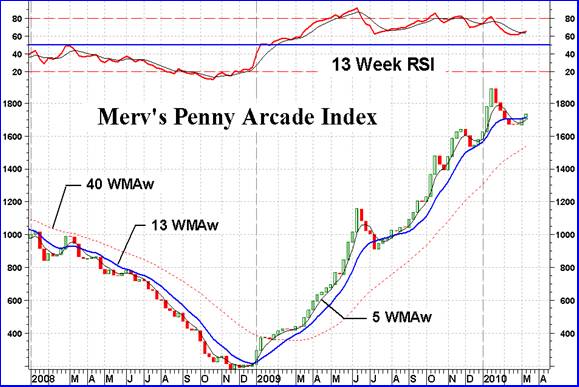
The Merv’s Penny Arcade Index has been showing weakness lately but over the past couple of weeks seems to be perking up again. The Index is once more above all of its moving average lines and the intermediate term momentum indicator has crossed above its trigger line. Could good times be back in vogue with the pennies? At this time I would still be a little cautious with the pennies. I’d like to see some better strength before jumping in, but that’s only me.
Merv’s Precious Metals Indices Table
Well, that will be it for this week.
By Merv Burak, CMT
Hudson Aero/Systems Inc.
Technical Information Group
for Merv's Precious Metals Central
For DAILY Uranium stock commentary and WEEKLY Uranium market update check out my new Technically Uranium with Merv blog at http://techuranium.blogspot.com .
During the day Merv practices his engineering profession as a Consulting Aerospace Engineer. Once the sun goes down and night descends upon the earth Merv dons his other hat as a Chartered Market Technician ( CMT ) and tries to decipher what's going on in the securities markets. As an underground surveyor in the gold mines of Canada 's Northwest Territories in his youth, Merv has a soft spot for the gold industry and has developed several Gold Indices reflecting different aspects of the industry. As a basically lazy individual Merv's driving focus is to KEEP IT SIMPLE .
To find out more about Merv's various Gold Indices and component stocks, please visit http://preciousmetalscentral.com . There you will find samples of the Indices and their component stocks plus other publications of interest to gold investors.
Before you invest, Always check your market timing with a Qualified Professional Market Technician
Merv Burak Archive |
© 2005-2022 http://www.MarketOracle.co.uk - The Market Oracle is a FREE Daily Financial Markets Analysis & Forecasting online publication.