No Gold Price Manipulation
Commodities / Gold and Silver 2010 Mar 11, 2010 - 04:15 PM GMTBy: Brian_Bloom

 Summary and Conclusions - Contrary to the opinions of various gold commentators it is the view of this analyst – flowing from the analysis below – that the gold price is not being manipulated at this juncture. The world appears to be about to enter a period of deflation. The severity of this deflation will be a function of the appropriateness of the behaviour of the world’s central banks in respect of their responsibilities to ensure that the fleet of economic ships maintains an even keel. If they over react at this point, we might experience a bursting of the debt bubble and a resulting world Depression. If they react with responsibility, then the probabilities favour a slow deflation of the debt bubble. The behaviour of the gold price and the bond yields in the past few days appear to be pointing to the fact that a dose of reality has crept into the thought processes of the world’s governments and central banks.
If you look at the P&F chart below (Courtesy StockChars.com) you will see how far it has risen above its trend line.
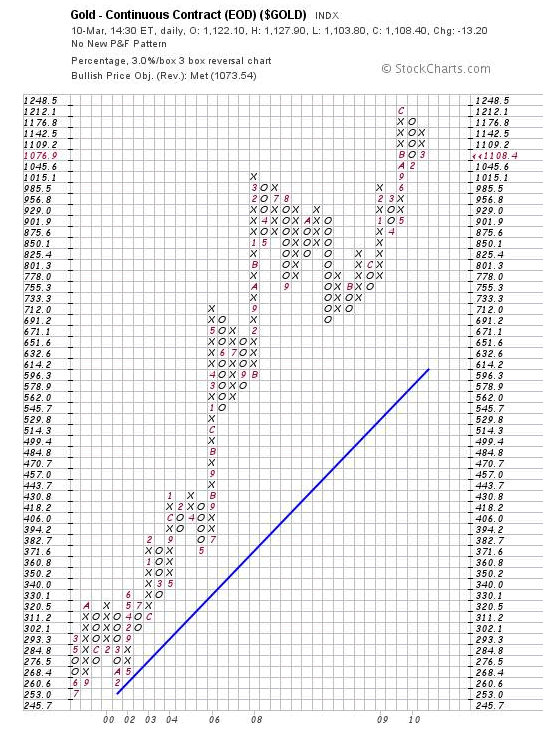
If gold were to break “up” from here the run will likely take it further away from its trend line and the only logical reason for this would be some fundamental disintegration of the world economy and a panic flight to safety.
The log scale chart below of the Dow Jones (Courtesy BigCharts.com) shows that The Dow has reached a critical juncture.
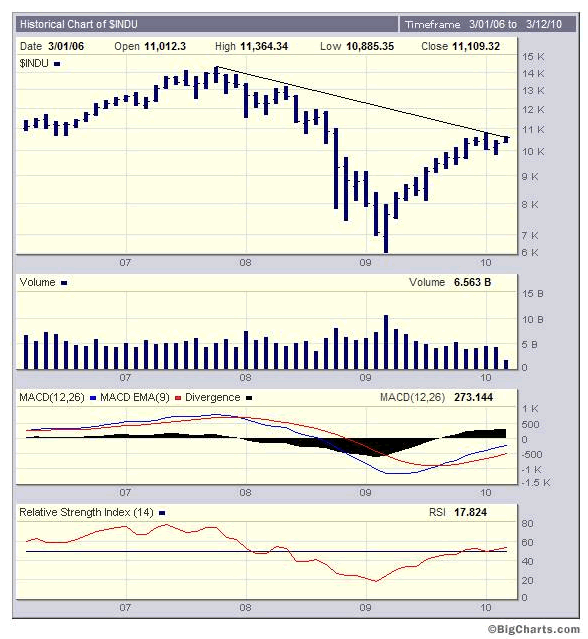
It is resting right on (below) its long term falling trend line.
The key to interpreting this chart, in my view, is the volume pattern. The price rose on falling volume since March 2009 (typically bearish) and this is the technical reason why the price broke down through the bottom support line of the rising wedge in the chart below. i.e. There was an exhaustion of buying “pressure”.
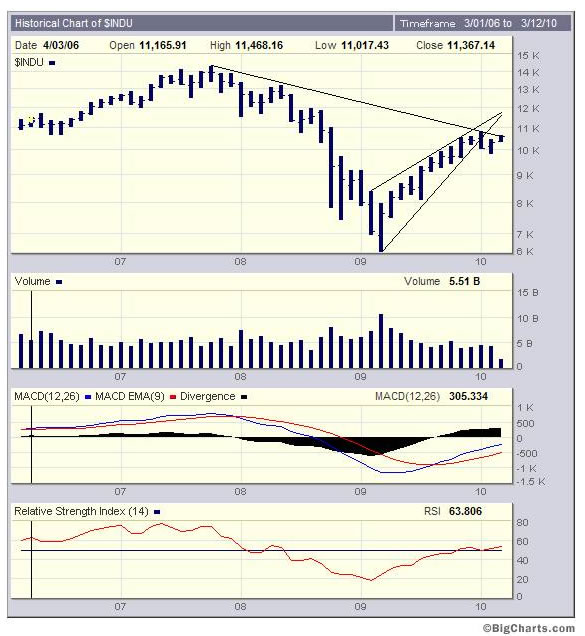
Typically following a breakdown from a falling wedge the price reverses upwards until it hits resistance. On VERY rare occasions, when the Primary direction of the market is bullish, the price continues to rise to new heights above the rising wedge; but this will only happen on RISING volume as buyers come stampeding into the market..
If, on the other hand we are in a Primary Bear Market then the rising wedge will likely turn out to be a technical reaction within that primary bear trend.
So what we need to determine is whether we are in a Primary Bull Market.
The key, in my view, to whether we are in a Primary Bull Market or a Primary Bear market is expectations of future earnings. (Richard Russell’ Primary Trend Index is a technical measure of this question and his PTI is Bullish. However, there is a non confirmation in terms of Dow Theory in that the Transports have risen a new high and the Industrial Index has not). Fundamentally, looking out into the future over the next 2-3 years, can we see earnings of US corporations rising?
Frankly, for the following reasons, I can’t see it because expectations of the future economy is what drives the market (the market looks ahead) and the US consumer drives the US economy which, in turn, accounts for roughly 23% of the world economy. With both the US and Europe in recession more than half the world economy is in recession at present and there are, as yet, no signs that the countries in these geographic zones are about to come out of recession. If anything, the risks of prolonged recession are rising as the stimulus programs of the various governments drive sovereign debt to ever higher levels.
What has been happening since March 2009 is that the US Federal Reserve has implemented a loose monetary policy which has allowed the Obama Government – through its stimulus programs – to take the place of the US consumer as the immediately proximate driver of the economy. This has given rise to a two fold reaction:
The stimulus did in fact prevent a collapse of the banking system and it was “hope” that spurred the share prices to rise
There was a “fear” of inflation which assisted in people’s decisions to stay in the markets and/or get into the markets.
But the fear of price inflation also caused a fear that the US dollar would collapse in the longer term and these twin fears (of rising inflation and a collapse in the US Dollar) were what drove the gold price up. Recently the gold price has been consolidating as can be seen from the point and figure chart above. Why has gold been consolidating?
The answer lies in the bond markets.
With the Fed allowing the Obama government to come storming into the OK Corral with its silver six guns blazing like there would be no tomorrow, the bond market began to manifest in the manners as shown in the chart below (courtesy DecisionPoint.Com):
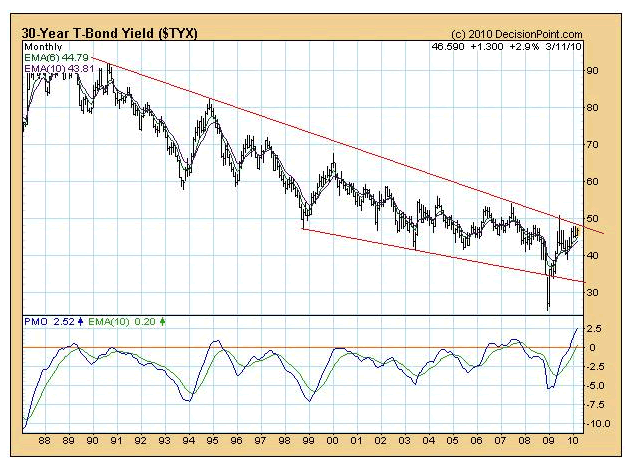
Note how the PMO on the monthly chart has risen to a new high. If inflation wins the day then the Dow Jones will likely break up through its falling trend line, the gold price will likely break up out of its consolidation triangle and the Bond Yield will break UP through its falling trend line – a trend line that has been falling for 22 years.
But the gold price chart below has been falling of late as can be seen in the daily chart below:
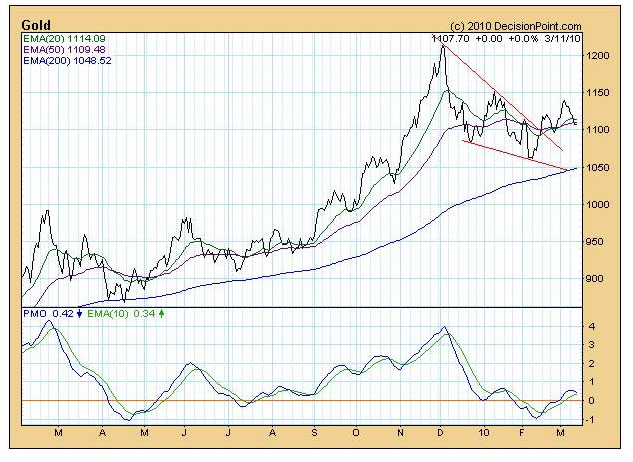
Note how the price is now below its 50 day Moving Average and note also how the PMO (which has been showing falling tops) seems to be wanting to turn over. If the gold price falls from here it will likely mean that the forces of deflation will prevail. In turn, this will mean that the Dow Jones will fail to break up through the falling trend line on the monthly chart above.
The Gold Bugs are screaming “price manipulation” so let’s have a look at what the daily chart of the 30 year bond yield has been saying:
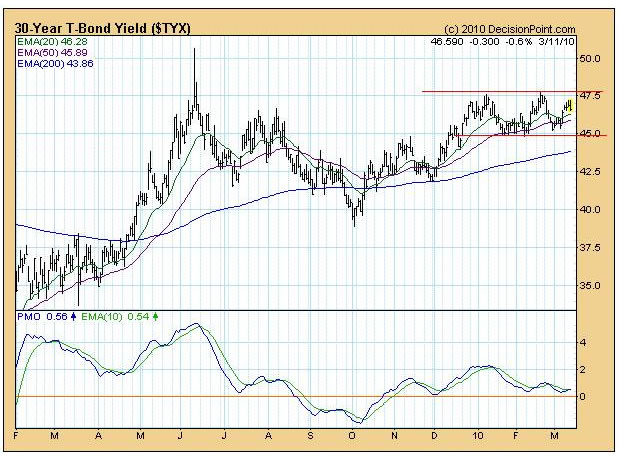
Interestingly, whilst the yield itself has been in a horizontal trading pattern and might break either way, the steam seems to have been going out of the rise – as evidenced by the falling tops in the Price Momentum Oscillator.
Recent comments by the Chinese Government in respect of its propensity to protect the US Dollar from collapse (for reasons that it does not want to place its $2 trillion Forex at risk) and this, coupled with its comments that is unlikely to want to be the buyer of the IMF’s gold, have served, in my view, to calm the markets in respect of the inflationary outlook.
However, the flip side of the coin is the possibility (likelihood?) of deflation given that the ever inflating bubbles of sovereign debt clearly have a limit. The pressure within these bubbles is now so great that either they will either have to burst (giving rise to a depression) or they will deflate (giving rise to a prolonged recession). The financial authorities are not stupid. In my view, they can see the risks associated with a burtsting bubble and are beginning to take their feet of f the accelerator pedals.
Can I see some fundamental reason why the world economy might begin to expand again after the debt issue has been resolved?
The short answer is “yes”.
As part of the base research for my next novel – the prequel to Beyond Neanderthal – my research into nuclear fission energy has led me to understand that there are literally dozens of plants on the drawing board, world-wide. Regardless of whether or not I agree with the rationale for this development it is happening. From about 2012 – 2014 they will likely begin to come on stream – as will other energy technologies such as thin film solar cells and advanced battery technologies. Wind energy technology will also take its place as a minor (but important) player on the world’s energy stage. These energy developments seem likely to be primary drivers of the world economy from around 2012 onwards but there will be a period of consolidation as the momentum of these energy technologies gains commercial traction. In the early years following 2012, this economic momentum will likely manifest as growing employment – which will generate income that people will use to pay down debt. The era of profligate consumerism has passed and it seems likely that people’s states of mind will be biased towards conservatism in respect of their personal financial affairs. The income streams to governments that flow from taxation on this increased activity will also likely be used to pay down debt. On balance, it seems that we might be able to avoid a catastrophic depression (provided the central banks and central governments of the world see the dangers associated with what they have been doing with their stimulus programs). There is currently overcapacity in legacy industries, world-wide and this seems likely to keep a lid on rising prices. In fact the odds probably favour some deflation.
Conclusion
The strange behaviour of the gold price is probably not the result of price manipulation. When seen in context of the behaviour of long bond yields (a market that cannot be manipulated) and in context of the Dow Jones having reached a critical juncture as the price rose in a technical upward reaction following a breakdown from the rising wedge, the movement of the gold price has been consistent with normal market behaviour.
The only reason why the price of gold might rise from here is if the market takes the view that central governments have lost the plot and will continue to print money ad infinitum. In this event, the gold price will explode upwards, the Dow Jones Industrial Index will enter a new Primary Bull Market and Bond Yields will break a 22 year falling trend to the upside. In turn, rising yields will savagely impact on the ability of already indebted consumers to continue consuming. Rising yields will be strongly counterproductive at this point and anyone who is even mildly versed in the subject of economics can see this. Central Banks are not “mildly” versed in the subject of economics. They are populated by some of the most knowledgeable people in the world in this subject.
At the end of the day, the answer to the question of whether or not central governments have lost the plot is a function of your own judgment. But one needs to recognize that, at this juncture, you will not be taking an informed decision regarding the date of mind of the world’s central governments. You will be taking a gambler’s bet. The evidence strongly suggests that, because the world has too much debt, this debt now has to be given the opportunity to work its way through the system – however politically distasteful this may seem.
By Brian Bloom
Once in a while a book comes along that ‘nails’ the issues of our times. Brian Bloom has demonstrated an uncanny ability to predict world events, sometimes even before they are on the media radar. First he predicted the world financial crisis and its timing, then the increasing controversies regarding the causes of climate change. Next will be a dawning understanding that humanity must embrace radically new thought paradigms with regard to energy, or face extinction.
Via the medium of its lighthearted and entertaining storyline, Beyond Neanderthal highlights the common links between Christianity, Judaism, Islam, Hinduism and Taoism and draws attention to an alternative energy source known to the Ancients. How was this common knowledge lost? Have ego and testosterone befuddled our thought processes? The Muslim population is now approaching 1.6 billion across the planet. The clash of civilizations between Judeo-Christians and Muslims is heightening. Is there a peaceful way to diffuse this situation or will ego and testosterone get in the way of that too? Beyond Neanderthal makes the case for a possible way forward on both the energy and the clash of civilizations fronts.
Copies of Beyond Neanderthal may be ordered via www.beyondneanderthal.com or from Amazon
Copyright © 2010 Brian Bloom - All Rights Reserved
Disclaimer: The above is a matter of opinion provided for general information purposes only and is not intended as investment advice. Information and analysis above are derived from sources and utilising methods believed to be reliable, but we cannot accept responsibility for any losses you may incur as a result of this analysis. Individuals should consult with their personal financial advisors.
Brian Bloom Archive |
© 2005-2022 http://www.MarketOracle.co.uk - The Market Oracle is a FREE Daily Financial Markets Analysis & Forecasting online publication.


