


Stock Market Rallies Getting Weaker and Weaker
Stock-Markets / Stock Markets 2010 Feb 27, 2010 - 04:52 PM GMTBy: David_Banister

 This is a commentary on the SP 500 index and the broader NYSE index. As I often mention here for Partners, we try to work in probabilities and then plan accordingly with our investing and trading. I look at Elliott Waves, Fibonacci levels, oversold and overbought patterns, cycles, and other indicators to give me some clues. Today, we look at an indicator called The Force Index.
The Force Index: Developed by Dr Alexander Elder, the Force index combines price movements and volume to measure the strength of bulls and bears in the market. The raw index is rather erratic and better results are achieved by smoothing with a 2-day or 13-day exponential moving average (EMA).
- The higher the positive reading on the Force index, the stronger is the bulls’ power.
- Deep negative values signal that the bears are very strong.
- If Force index flattens out it indicates that either (a) volumes are falling or (b) large volumes have failed to significantly move prices. Both are likely to precede a reversal.
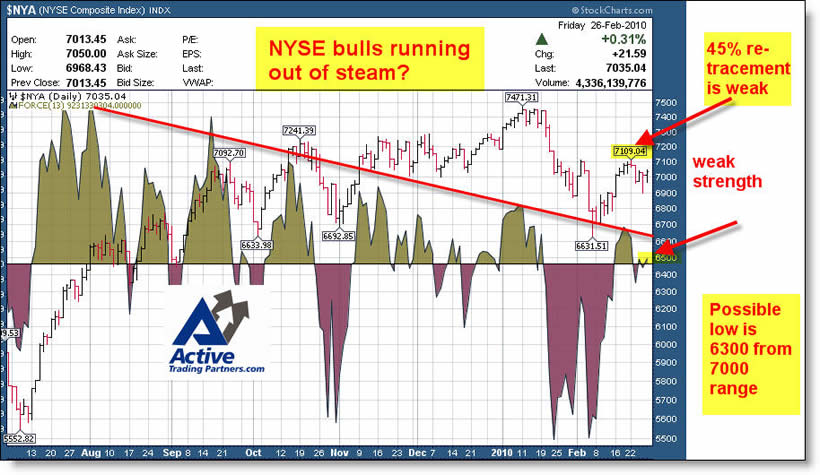
That last explanation I bolded because we may be under that type of condition. Below are two charts, one with the SP 500 and the other is the NYSE composite index. Recently, the NYSE composite has managed a light 45% re-tracement of the Jan/Feb decline, whereas the SP 500 has managed a stronger 67% re-tracement of the prior decline.
Some have surmised the SP futures are being manipulated most every monday morning by strange and heavy futures buying in pre-market. 22 of the last 25 weeks this has been the case, yet the overall internals of the market are not showing as being very strong if you look at the Force Index. They especially show up weak if you view the larger NYSE composite index, which would be much harder to “paint” as it were.
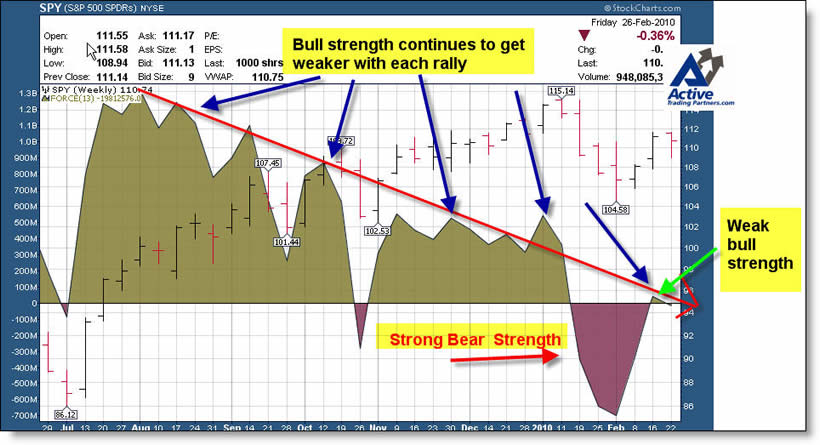
My point on these charts is to look at the brown color for the Force index as it relates to the market movements over several months. As that brown graph gets weaker with each rally, it means the bulls have less and less power and volume and money pushing the market higher. Most recently, this last market rally has been the weakest in months according to The Force Index indicator, and again, helps to provide me with clues that a C wave down is still due.
This may help you all understand my apprehension near term on the broader markets and why we have positioned or recommended positioning in the EDZ and/or the TZA ETF’s. The market may bounce a bit higher early in the week to complete the zig zag bounce from the Feb lows, but I expect a re-test of the Jan/Feb lows to commence. If I’m wrong, it won’t be the first time nor the last…
SP 500 Weekly Chart
NYSE Composite Chart - Daily Chart
Dave Banister
CIO-Founder
Active Trading Partners, LLC
www.ActiveTradingPartners.com
Dave Banister is the Chief Investment Strategist and commentator for ActiveTradingPartners.com. David has written numerous market forecast articles on various sites (SafeHaven.Com, 321Gold.com, Gold-Eagle.com, TheStreet.Com etc. ) that have proven to be extremely accurate at major junctures.
© 2010 Copyright Dave Banister- All Rights Reserved
Disclaimer: The above is a matter of opinion provided for general information purposes only and is not intended as investment advice. Information and analysis above are derived from sources and utilising methods believed to be reliable, but we cannot accept responsibility for any losses you may incur as a result of this analysis. Individuals should consult with their personal financial advisors.
© 2005-2022 http://www.MarketOracle.co.uk - The Market Oracle is a FREE Daily Financial Markets Analysis & Forecasting online publication.