


Stock Market Former Support is Now Resistance
Stock-Markets / Stock Index Trading Feb 09, 2010 - 02:18 AM GMTBy: Graham_Summers

 Yesterday I explained why the market began to rally sharply Friday afternoon. Today we’re looking at where the market is from a technical perspective. Be forewarned, if you’re a bull, what follows isn’t pretty.
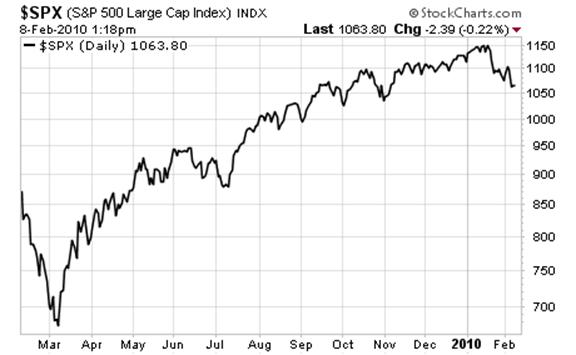
For starters, the first thing we need to keep prominent in our thinking is that the market rally from March 2009-January 2010 was largely a technically driven rally fueled by easy money from the world’s Central Banks: Governments around the engaged in an unprecedented amount of stimulus/ bailouts and much of this money found its way into the financial markets.
How do I know this?
The S&P 500 rose 60+% in the US and 100+% in many emerging markets.
While the underlying fundamentals continue to deteriorate (the exception being corporate profits which have only marginally improved from March’s “the world is ending” results):
| In March 2009 | Today | |
| Unemployment | 8.5% | 9.7% |
| People on Food Stamps | 33.1 million | 38.2 million |
| Corporate Profits | $1.9 trillion | $2.0 trillion |
| Mortgages Underwater | 1 in 5 | 1 in 4 |
Again, this market rally was fueled by loose money. And it was driven by technical’s, not fundamentals:
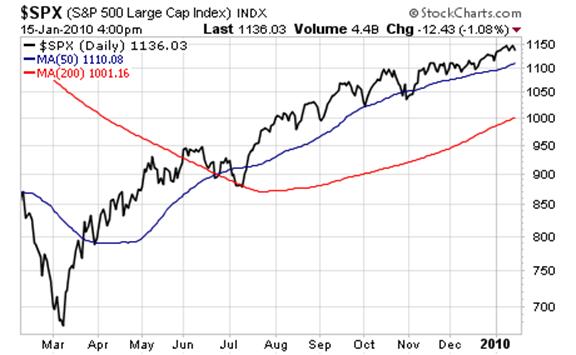
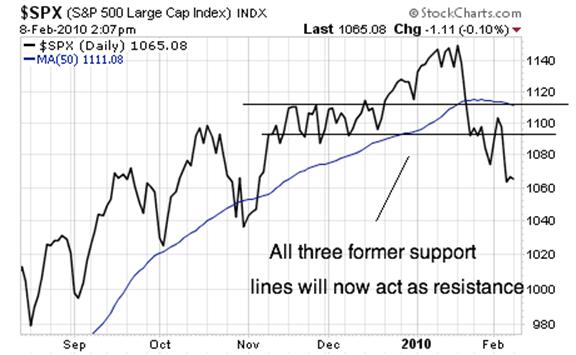
As you can see, the S&P 500 broke above its 50-DMA in March 2009 and didn’t look back. There was only one real violation of the 50-DMA during the entire 10-month rally. However, even then we got a massive bounce off the 200-DMA resulting in the market starting its next leg up. Of course, the Fed’s juicing during options expiration week in July didn’t hurt.
Aside from that correction, stocks stayed above their 50-DMA from March until recently, using that line as support time and again during the rally. Like I said, this was a market rally that was driven by technicals.
With that in mind, we are now going to examine this latest correction from a technical standpoint.
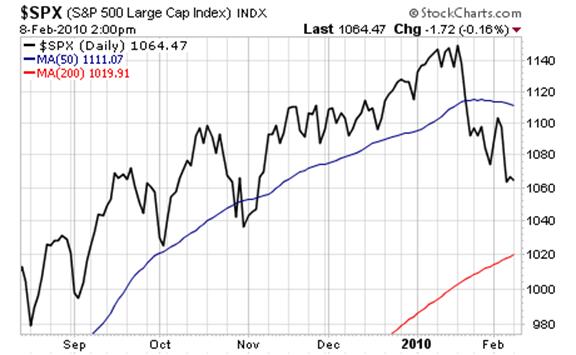
First and foremost, we see that the S&P 500 sliced cleanly through its 50-DMA like a hot knife through butter. The picture is even uglier when we note that the S&P 500 also broke through both 1,110 AND 1,190: two lines of major support that were established during a two-month trading range.
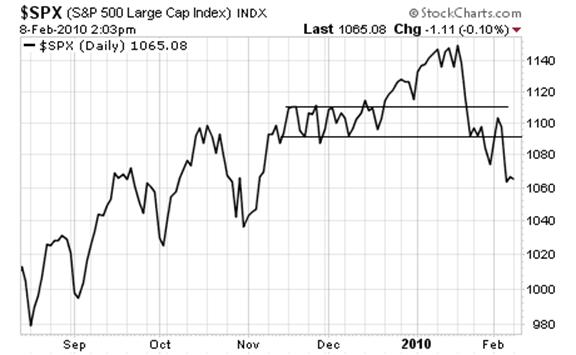
Thus we now have three former lines of support (the 50-DMA at 1,111, 1,010 and 1,090) that will now serve as overhead resistance should the bulls attempt to regain control and kick off another rally.
In contrast, the next lines of major support are the November low (1,040), the October low (1,025) and the 200-DMA (1,019).
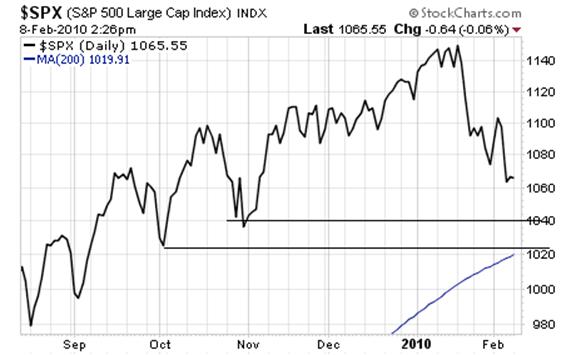
Thus we are in a range bound market with the bulls and bears battling it out until the market either breaks above 1,090 or falls below 1,040. My take is that the general trend is now down. We could see a bit of a bounce here, perhaps even an attempt at 1,090. But ultimately the market is going lower and will break below 1,040.
Good Investing!
Graham Summers
PS. I’ve put together a FREE Special Report detailing THREE investments that will explode when stocks start to collapse again. I call it Financial Crisis “Round Two” Survival Kit. These investments will not only help to protect your portfolio from the coming carnage, they’ll can also show you enormous profits.
Swing by www.gainspainscapital.com/roundtwo.html to pick up a FREE copy today!
Graham Summers: Graham is Senior Market Strategist at OmniSans Research. He is co-editor of Gain, Pains, and Capital, OmniSans Research’s FREE daily e-letter covering the equity, commodity, currency, and real estate markets.
Graham also writes Private Wealth Advisory, a monthly investment advisory focusing on the most lucrative investment opportunities the financial markets have to offer. Graham understands the big picture from both a macro-economic and capital in/outflow perspective. He translates his understanding into finding trends and undervalued investment opportunities months before the markets catch on: the Private Wealth Advisory portfolio has outperformed the S&P 500 three of the last five years, including a 7% return in 2008 vs. a 37% loss for the S&P 500.
Previously, Graham worked as a Senior Financial Analyst covering global markets for several investment firms in the Mid-Atlantic region. He’s lived and performed research in Europe, Asia, the Middle East, and the United States.
© 2010 Copyright Graham Summers - All Rights Reserved
Disclaimer: The above is a matter of opinion provided for general information purposes only and is not intended as investment advice. Information and analysis above are derived from sources and utilising methods believed to be reliable, but we cannot accept responsibility for any losses you may incur as a result of this analysis. Individuals should consult with their personal financial advisors.
Graham Summers Archive |
© 2005-2022 http://www.MarketOracle.co.uk - The Market Oracle is a FREE Daily Financial Markets Analysis & Forecasting online publication.