U.S. Joins Global Debt Bomb Club
Stock-Markets / Financial Markets 2010 Feb 08, 2010 - 05:21 AM GMTBy: Money_Morning
 Jon D. Markman writes: The most important fundamental development of the week was not any of a slew of economic reports at all but the new federal budget proposal released by the White House. And it was a doozy: The Obama Administration proposed to spend $3.8 trillion, with $1.6 trillion on the equivalent of the national credit card.
Investors did not overtly seem to mind today, but they will. It is almost mind-numbing to think we've gone from the surplus that President Clinton left President Bush to the trillion-dollar hole we're in now. There is nothing good about the scenario of bone-crushing debt, as we have seen repeatedly throughout the world recently in places like Dubai, Greece, the United Kingdom and Japan. The fact that the U.S. dollar has managed to hold its own despite representing a country deeply in hock is only testament to the weakness of every other major developed-world government.
It's ironic in fact that plenty of emerging-market countries are managing their books far better than the United States and Europe. They include Chile, Azerbaijan, Angola, Ukraine and Romania -- all with debt at less than 15% of national GDP, while we are knocking on 60%!
We can carry on at being blase about this so long as our lenders will humor us. But the country has put itself in the untenable position of dependency on its creditors like China and Japan. It's almost worse than having a dependence on foreign sources of crude oil because there are alternatives to fossil fuels such as our abundant natural gas, coal, sunshine and wind. There is no alternative to debt repayment except the one that the Federal Reserve is desperately attempting at the moment, much like Zimbabwe, and that is printing more money through a variety of methods, including the mundane issuance of Treasury bonds and the much more mysterious "quantitative easing."

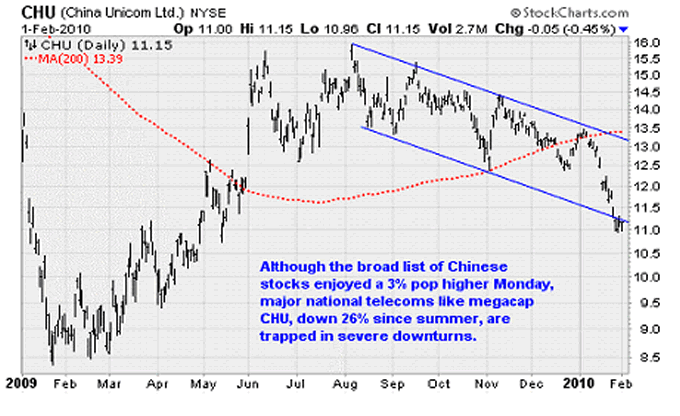
For now we are locked in miserable embrace with China, as they cannot halt their lending to us without harming their own economy, which is already fraying at the edges, as you can see in major telecoms like China Unicom Ltd. (NYSE ADR: CHU), down 30% since August. If they force the United States into default, who will buy their poisoned toys and jewelry?
Seriously, at this point in their lifecycle as a growing economy, Beijing leaders cannot afford to cut off our borrowing. But 10 or 15 years down the road, when their domestic economy is stronger, it may not be such a tough decision. And that is why, in part, investors are soon going to demand that U.S. lawmakers get their spending under control. When that happens, as it must, the economy will inevitably slow down. This could happen a lot sooner than most believe possible.
In fact, it may happen next year. The Congressional Budget Office's latest forecast for the next two years, which has not garnered much attention, concluded that economic growth will not be enough to bring the national unemployment rate under 10% through at least September 2011. CBO chief Douglas W. Elmendorf said the economy will grow by a scant 1.6% this year and 1.8% in 2011, and that the jobless rate will stabilize at 9.8% to 10.2%
Slow growth of this nature ensures deficits of $1 trillion through 2011. In an appearance before Congress last week, Elmendorf called the debt bomb a dangerous level that puts the country's future into peril. "It is true that as we push [public debt] to 60% of GDP at the end of this year and beyond that over the next few years, we're moving into [debt] territory that most developed countries stay out of,'' he said.
This is serious stuff, and it is why voters appear to feel in their gut that the government has veered off in the wrong direction by tackling health-care reform and vilifying bankers when it should be focused 100% every day on seeking ways to encourage companies to expand and create new jobs.
Markets Last Week
Stocks rose slightly Friday after a robust late-day rally, closing out a dismal week and start to the month.Shares had plenty of reasons to march higher this week but no amount of good news could convince buyers to extend or even maintain early morning gains. People just wanted out of stocks. The government's GDP report showing that the economy expanded at its fastest rate in six years during the fourth quarter was ignored. A collection of positive earnings reports was panned as investors focused on cautious guidance on future results.
Instead, doubts over the health of the recovery, President Obama's plans to shrink the banks, and monetary, budget and social turmoil in Greece weighed on the minds of investors. You just know that when a small country like Greece is shaking up the entire world, something new is happening.
Although there wasn't a sense of total panic in the air (the CBOE Volatility Index remains well under its recent high) clearly a "sell everything" mentality has crept into investors' minds. Trades were becoming increasingly one-sided. How else can you explain large, high-quality companies like Microsoft Corp. (NASDAQ: MSFT) dropping in 30-cent gaps on Friday like a thinly traded penny stock, as the sellers piled on? This is the kind of urgent selling that occurs amid fear, not patient planning.

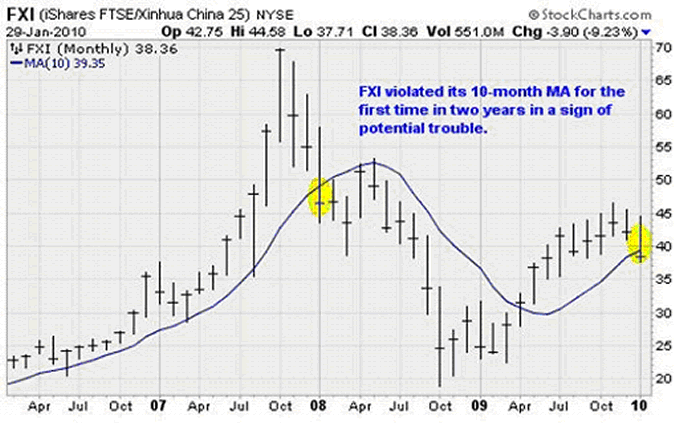
I recommended exiting all emerging market positions in mid-January and will not recommend a return until FXI records a monthly close back over its 7-month MA. The emerging markets may rebound over that level in the short-term but the downside risk has become unacceptable.
The fundamental story behind the chart is that investors are becoming increasingly disillusioned with the China growth story. This is a result of increased efforts by Chinese authorities try to cool runaway loan growth by clamping down on bank lending. The worry is that frothy real estate and stock prices, as well as overinvestment in factories, could result in inflation and destabilize the economy and leadership structure. The oppressive communists that run China depend on low inflation and fast economic growth to quell social unrest; any deviation from this path could ignite explosive revolutionary tendencies among out-of-work farmers and factory workers.
DOLLAR
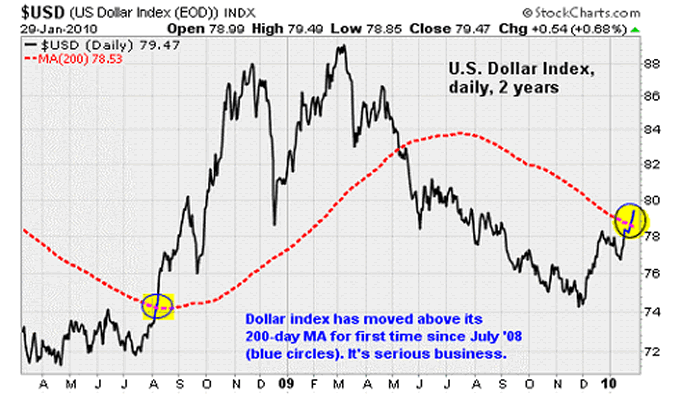
Also contributing to the relative outperformance of American stocks compared to foreign equities has been the awesome strengthening in the U.S. dollar -- a development we forecast late last year. This is because global traders like to park their cash in assets denominated in strengthening currencies. The dollar may be extended at the moment, but we've often seen the start of major upswings in currencies run like crazy.
Just look at the last major move up in the buck in August 2008, when the U.S Dollar Index went from 74 to 80 almost without a correction, then slipped back to 76 before zooming to 88. That kind of move is unlikely to recur, but a smaller-scale version would not surprise me.
The best way to take advantage is via PowerShares DB US Dollar Index Bullish ETF (NYSE: UUP), preferably with call options for more leverage. Another way to go can be the ProShares UltraShort Euro ETF (NYSE: EUO), since the euro tends to move inversely to the U.S. dollar.
Levels to Watch
A number of technical measures suggest we're rapidly nearing a short-term turnaround for stocks. This comes within the context of a larger consolidation period that is set to last through the summer as the S&P 500's 10-month moving average catches up with the underlying index.In short, long-term measures of strength, based on market breadth, remain intact. The bull market lives, but it won't look that way as it is set to take a breather for the better part of 2010.
To summarize my view: Short-term bullish after the recent thumping, medium-term bearish, and long-term bullish. Since numbers are easier to visualize than words in this case, here are the levels to watch:
At some point in the next few days or weeks, expect a rebound to a "lower high" as high as the 1,120 level of the S&P 500 Index. Then over the following eight months, expect a decline to around 950, which was the breakout level back in July last year.
After that, my expectation is that the bull cycle that appears to have begun last March can get started again, and stocks can start motoring back toward the January high and well beyond.
None of this should come as a surprise. We've been laying the groundwork for this scenario over the past few weeks by delving into market history and looking into similar periods of transition as the recovery matures and central banks around the world prepare to reduce the doses of monetary adrenaline injected into the heart of the global economy.
The two best recent examples were an 19-month span in 1983-1984 and an eight-month span in 2004. Both of these down-biased sideways markets started later in the year (March in 2004 and June in 1983), which is why the January start of the recent slip took me a bit by surprise.
How to play it? For many investors the best recipe will be bonds and patience. For those who are more active, we've also noted how it will become increasingly important to identify which sectors are poised for outperformance as the broad market suffers through this long, choppy consolidation. Performance differentiation will become more pronounced between leaders and laggards.

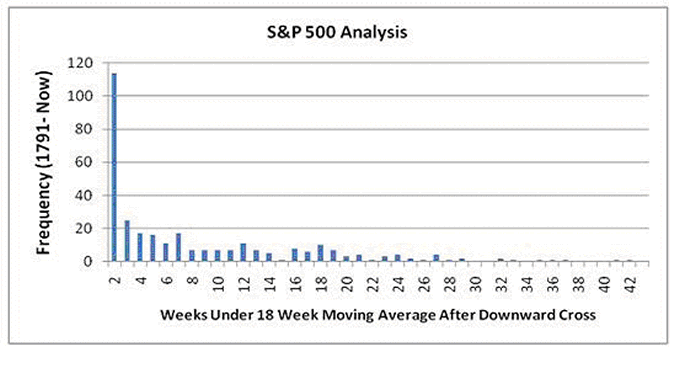
For more clues on how this might play out, over the weekend I reviewed stock market data stretching back to 1791 (courtesy of Global Financial Data). My goal was to study the effect of the S&P 500's downward cross of its important 18-week moving average. I was hoping that stocks could manage a rally on Friday to push back over that level since on average it takes the S&P 500 eight weeks to move back over its 18-week moving average. That didn't happen, obviously.
So eight weeks of more setbacks right? Well, maybe not. That simple eight week average hides a few important observations. As you can see in the chart above, most violations of the 18-week average are quickly reversed within one to two weeks. With the underlying trend of supply and demand for stocks still favorable, my guess is the current situation plays out as a quick turnaround before heading south again.
I continue to see lots of parallels to what happened back in 2004, which was the last time the economy was recovering and the Federal Reserve was preparing to tighten policy. Back in March of that year, there was a short two week excursion beneath the 18-week moving average. That was followed by two deeper plunges of 6 weeks and 7 weeks in length before the bull market kicked back into high gear in late summer. Beware, and prepare for turbulence.
Week in review:
Monday: The ISM Manufacturing Index for January shot up to 58.4 as new orders continue to pour into American factories. The result was well ahead of the 55 consensus estimate and November's 55.9 reading. This is the sixth straight month of growth -- which is indicated by the index going over the 50 level. New orders are causing a big rise in factory backlogs. Eventually, production managers will have no choice but to hire new workers and increase output.Also, Exxon Mobil Corp. (NYSE: XOM) reported better-than-expected quarterly earnings of $1.27 per share -- ahead of the $1.19 consensus estimate on a 6.1% increase in revenue.
Tuesday: Domestic motor vehicle sales came in at a weaker-than-expected 7.9 million annual rate. This was well below December's 8.5 million annual rate and the consensus estimate of 8.4 million. The sales decline as a result of Toyota Motor Corp.'s (NYSE ADR: TM) gas accelerator problems weren't fully made up by other manufacturers. It seems that many who have their heart set on a Toyota Camry just decided to wait it out until a fix is found. The result will weigh on January's retail sales report.
Wednesday: The ISM Non-Manufacturing Index, which represents the much larger services sector of the economy, increased slightly to 50.5. Any reading over 50 indicates growth. Still, the result was below consensus expectations of 51. The new orders sub-index increased to 2.5 points to 54.7, its highest reading in more than two years.
Thursday: Wall Street was covered with the blood of the bulls. Concerns over the debt of high-deficit countries in Europe mixed with a surprisingly weak weekly jobless claims report. Initial claimed jumped 8,000 to 480,000 for the week of January 30. As a result, investors sold foreign sovereign bonds, bought up credit protection, and abandoned risky positions in favor of the safety of the U.S. dollar and U.S. Treasury debt.
Friday: The big January Employment Situation report was something of a mixed bag. The unemployment rate dropped three-tenths of a percent to 9.7%. However, payrolls continue to decline falling another 20,000. Also, the government unveiled their annual revision to their employment estimates. The changes weren't pretty: The total net job loss since the recession started in December 2007 increased to 8.4 million from 7.2 million previously. The takeaway here is that the economy is weaker and unemployment much more pervasive than many believed. The road back to full employment will be long and arduous indeed.
The week ahead:
Monday: No major economic releases.Tuesday: The Coca-Cola Co. (NYSE: KO) reports quarterly results.
Wednesday: Global steelmaking behemoth Arcelor Mittal (NYSE ADR: MT) reports quarterly results. An update on the U.S. trade balance for December will provide insight on the health of the American export sector -- which has been providing a boost to GDP growth lately. Recent struggles in Europe, a rising dollar, and higher crude oil all point to a larger trade deficit -- which will drag on Q1 GDP.
Thursday: Weekly jobless claims, January retail sales, and business inventories will be reported.
Friday: A read on consumer confidence as the University of Michigan releases its Consumer Sentiment Index.
Editor's Note: As the story above demonstrates, Money Morning Contributing Writer Jon Markman has a unique view on the markets. With uncertainty the watchword and volatility the norm in today's markets, profitable investments are harder than ever to find. It takes a seasoned guide to find those opportunities.
Markman is that guide.
As this column demonstrates, veteran portfolio manager, commentator and author Jon Markman sees it all. And that's why investors subscribe to his Strategic Advantage newsletter every week.
In the face of what's been the toughest market for investors since the Great Depression, it's time to sweep away uncertainty and eradicate worry. Subscribe to Strategic Advantage. Hire Markman to be your guide. For more information, please click here.]
Source:http://moneymorning.com/2010/02/08/debt-bomb-2/
Money Morning/The Money Map Report
©2010 Monument Street Publishing. All Rights Reserved. Protected by copyright laws of the United States and international treaties. Any reproduction, copying, or redistribution (electronic or otherwise, including on the world wide web), of content from this website, in whole or in part, is strictly prohibited without the express written permission of Monument Street Publishing. 105 West Monument Street, Baltimore MD 21201, Email: customerservice@moneymorning.com
Disclaimer: Nothing published by Money Morning should be considered personalized investment advice. Although our employees may answer your general customer service questions, they are not licensed under securities laws to address your particular investment situation. No communication by our employees to you should be deemed as personalized investment advice. We expressly forbid our writers from having a financial interest in any security recommended to our readers. All of our employees and agents must wait 24 hours after on-line publication, or 72 hours after the mailing of printed-only publication prior to following an initial recommendation. Any investments recommended by Money Morning should be made only after consulting with your investment advisor and only after reviewing the prospectus or financial statements of the company.
Money Morning Archive |
© 2005-2022 http://www.MarketOracle.co.uk - The Market Oracle is a FREE Daily Financial Markets Analysis & Forecasting online publication.


