


How to Trade IntraDay Gold and SP500 Stocks Index
InvestorEducation / Learn to Trade Feb 07, 2010 - 07:15 PM GMTBy: Chris_Vermeulen

 Last week was an incredible week for trading the intraday charts. With rising volume and volatility prices began to move up or down for extended periods of time allowing traders to profit from these powerful short term price swings.
During times like these traders using the daily charts for their guide found the market very difficult to time because of the whipsaw action each day. In this case, it is definitely best to stay clear of the market until the dust settles. But for a trader who watches the intraday charts, this is when serious money is made on a daily and consistent basis.
Most traders avoid using intraday charts because they either:
1. Think it’s day trading and do not want to sit in front of the computer all day
2. Do not understand how to trade in these “intraday” time frames.
Intraday trading is one of the most over looked yet most profitable trading strategies, in my opinion. One of the reasons I like/love it so much is the fact that it provides high probability setups on a weekly basis and trades generally last 2 -36 hours. Also, this strategy carries very low risk simply because you are in cash most of the time, putting your money to work only when high probability setups form.
If you are an active trader you should have been making money hand over fist last week. Below are close up shots of my charts:
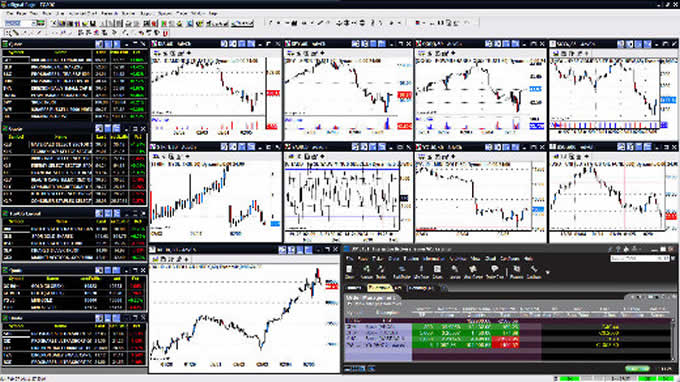
My eSignal Trading Platform
This is my main trading screen which allows me to see the entire market. This, to me, is like a dashboard of an airplane. Each mini intraday chart is like a gauge hinting to what the plane in doing (horizon indicator, fuel, air speed etc.) My custom dashboards quickly allow me know if the market is heading up or down, what speed it is moving measured by volume and momentum, and if all pistons are firing which sector is really moving.
My Custom Dashboard
Quotes for every index and sector
Top Row: 60 minute charts with volume of: DIA, SPY, QQQQ and NYSE
Second Row: 60 min chart of NYSE TRIN, NYSE Adv/Dec, 60min Gold, 60min Oil
Bottom Row: 120 minute chart of the US Dollar, Interactive Brokers Trade Window
In short, I can see waves of money flowing in and out of each sector. These views give me a strong sense as to the strength of momentum. From these observations I determine whether the setup is favorable for shorting into light volume rallies, shorting into resistance levels or buying oversold sell offs in up trends.
Also, the chart patterns on the 60, 240 and 480 minutes charts are so powerful and accurate that you only need 2-3 trades a week in order to make decent money.
I would like to note that I do have 4 larger charts with different time frames allowing me to really get a feel for a trade before I commit money. These charts are Weekly, Daily, 240 minute and the 60 minute chart.
If you want to see some exciting daily charts of gold, sp500, oil and silver check out my weekend report:
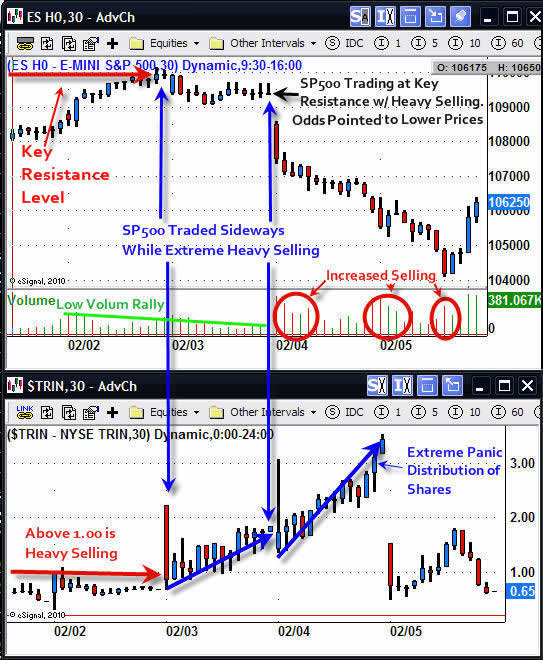
SP500 Day Trading Futures Signal – 30 Minute Chart
The SP500 ES mini contract, or you could have traded the SPY exchange traded fund, provided an excellent intraday short trade last Wednesday.
All the indexes (NYSE, NASDAQ, SP500, DOW) drifted higher on light volume. While you can play the long side of these low volume rallies I prefer to stay in cash and wait for another short setup. Trading with the short term trend (240, 480minute charts) is crucial. Counter trend plays tend to be weak and short lived.
In short, the SP500 drifted into a resistance level on light volume and the NYSE TRIN indicator was rising in a very strong way. The combined information of price, volume and the TRIN indicator were screaming – short the market.
When the TRIN is above 1.00 it means the majority of the trades being executed on high volume NYSE stocks are sell orders. You don’t see the TRIN rise this high without the market selling off as it did on Feb 3rd. But when it does, Bombs Away – time to go short!
The next day the index crashed with panic selling across the board. The NYSE had over 30 sell orders for every 1 buy order. Now that is panic selling and, coincidentally, exactly as has happened at each bottom formed throughout 2009.
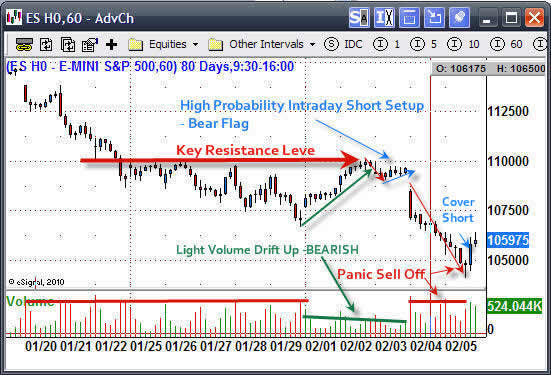
Intraday Trading SP500 – 60 Minute Chart
This chart clearly shows the high probability setup which took a few days to form. A short position was taken during the small bear flag pattern. My short position was covered on the break of a new high formed on heavy buying volume.
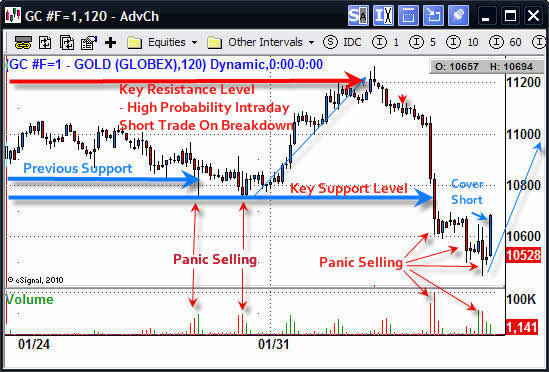
Intraday Trading Gold Futures – 120 Minute Chart
Gold had virtually the same setup as the SP500.
Intraday Trading Gold & SP500 Futures or ETF’s Conclusion:
As you can see intraday trading is nothing like what most people think it is. Trading using the 60, 240 and 480 minute charts really opens one’s eyes, allowing a panoramic view of the price action the market has to offer.
As most of you know, my goal is to trade low-risk, high-probability setups. And, the less time my money has to be in the market, the better.
Get my Free Weekly ETF Trading Reports at www.GoldAndOilGuy.com
Hello, I'm Chris Vermeulen founder of TheGoldAndOilGuy and NOW is YOUR Opportunity to start trading GOLD, SILVER & OIL for BIG PROFITS. Let me help you get started.
To Your Financial Success,
By Chris Vermeulen
Chris@TheGoldAndOilGuy.com
Please visit my website for more information. http://www.TheGoldAndOilGuy.com
Chris Vermeulen is Founder of the popular trading site TheGoldAndOilGuy.com. There he shares his highly successful, low-risk trading method. For 6 years Chris has been a leader in teaching others to skillfully trade in gold, oil, and silver in both bull and bear markets. Subscribers to his service depend on Chris' uniquely consistent investment opportunities that carry exceptionally low risk and high return.
This article is intended solely for information purposes. The opinions are those of the author only. Please conduct further research and consult your financial advisor before making any investment/trading decision. No responsibility can be accepted for losses that may result as a consequence of trading on the basis of this analysis.
Chris Vermeulen Archive |
© 2005-2022 http://www.MarketOracle.co.uk - The Market Oracle is a FREE Daily Financial Markets Analysis & Forecasting online publication.