


Stock Market Bottom Are We There Yet?
Stock-Markets / Stock Markets 2010 Feb 07, 2010 - 03:32 AM GMTBy: Guy_Lerner

 Like those long distance car trips I take with my children where 90 minutes into an 8 hour drive they say, "Are we there yet?", market participants are wondering the same: are we there yet? Will the recent bout of selling entice the buyers such that the market will revisit the highs last seen only 4 short weeks ago? Anything can happen, but from a sentiment perspective, the answer remains same as last week: complacency reigns and this is not a high reward, low risk investing environment.
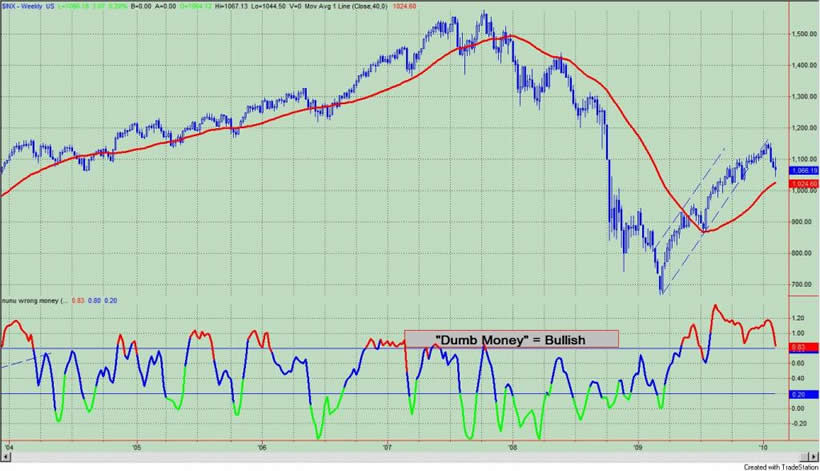
The "Dumb Money" indicator, which is shown in figure 1, looks for extremes in the data from 4 different groups of investors who historically have been wrong on the market: 1) Investor Intelligence; 2) Market Vane; 3) American Association of Individual Investors; and 4) the put call ratio. The "Dumb Money" indicator shows that investors remain extremely bullish.
Figure 1. "Dumb Money" Indicator/ weekly
The "Smart Money" indicator is shown in figure 2. The "smart money" indicator is a composite of the following data: 1) public to specialist short ratio; 2) specialist short to total short ratio; 3) SP100 option traders. The Smart Money indicator is neutral to bearish.
Figure 2. "Smart Money" Indicator/ weekly
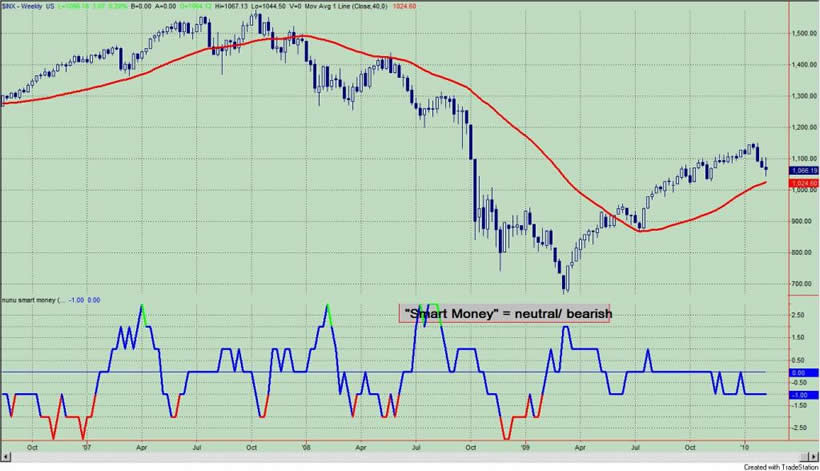
Figure 3 is a weekly chart of the S&P500 with the InsiderScore "entire market" value in the lower panel. Insider trading volumes remain light although selling continues to out pace buying.
Figure 3. InsiderScore Entire Market/ weekly
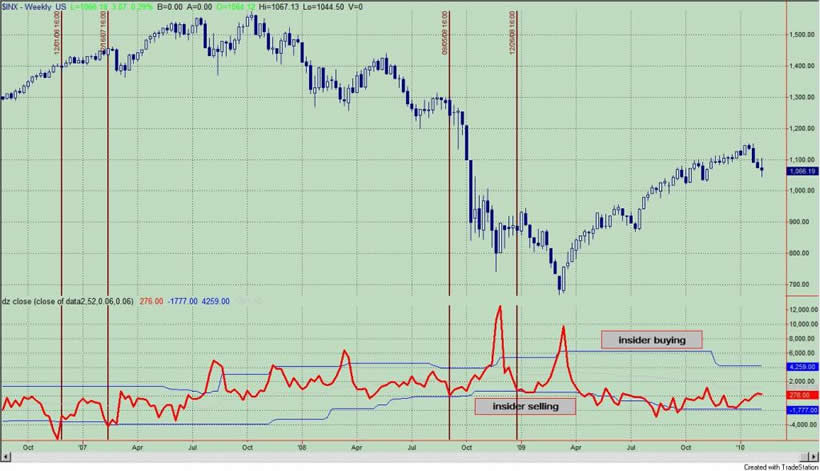
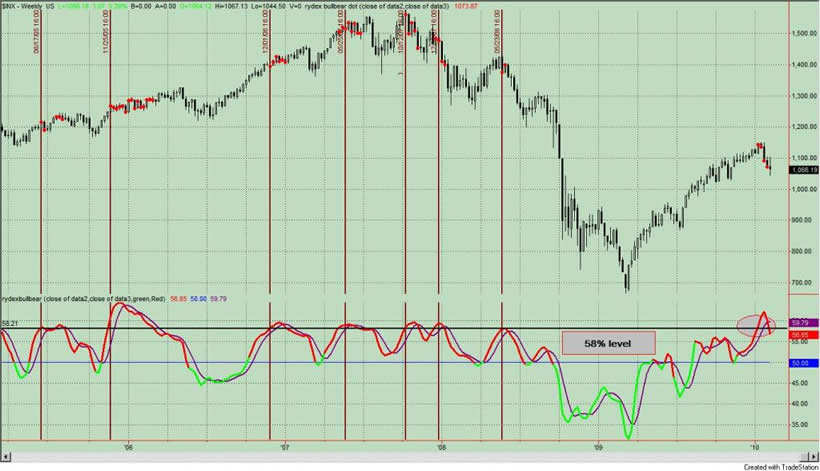
Figure 4 is a weekly chart of the S&P500. The indicator in the lower panel measures all the assets in the Rydex bullish oriented equity funds divided by the sum of assets in the bullish oriented equity funds plus the assets in the bearish oriented equity funds. When the indicator is green, the value is low and there is fear in the market; this is where market bottoms are forged. When the indicator is red, there is complacency in the market. There are too many bulls and this is when market advances stall.
Currently, the indicator is red having peaked (with the market) above 58%. In other words at the market peak 4 weeks ago, greater than 58% of the assets were in bullish funds (leveraged and non leveraged) relative to all of the equity funds. There is nothing magical about the number 58%, but intermediate term swings in the past 10 years have been identified when this indicator exceeded the 58% mark. These extremes in the indicator are noted by the red dots on the price chart and the maroon colored vertical lines.
Figure 4. Rydex Total Bull v. Total Bear/ daily
Although the selling has been intense, the measures of investor sentiment have yet to show any real bearishness or fear, which would be a bull signal. Although feasible, I would doubt that the next best time to buy would occur without at least one measure of investor sentiment turning bearish (i.e, bear signal). Even during the great rally of 2009, the "dumb money" only became bullish after a 32% gain in the S&P500 from the March low. Furthermore, the almost 20% rally in the S&P500, which occurred in July and August, was courtesy of short covering as investors - typified by the Rydex timers - where betting against that rally too.
The "dumb money" remains complacent, and the "smart money" and company insiders continue their indifference. Nothing has changed from last week, last month, or even 4 months ago when the market was higher than it is now!! Once again, the sentiment indicators still suggest that better buying opportunities lie ahead.
Are we there yet? No!
By Guy Lerner
http://thetechnicaltakedotcom.blogspot.com/
Guy M. Lerner, MD is the founder of ARL Advisers, LLC and managing partner of ARL Investment Partners, L.P. Dr. Lerner utilizes a research driven approach to determine those factors which lead to sustainable moves in the markets. He has developed many proprietary tools and trading models in his quest to outperform. Over the past four years, Lerner has shared his innovative approach with the readers of RealMoney.com and TheStreet.com as a featured columnist. He has been a regular guest on the Money Man Radio Show, DEX-TV, routinely published in the some of the most widely-read financial publications and has been a marquee speaker at financial seminars around the world.
© 2010 Copyright Guy Lerner - All Rights Reserved
Disclaimer: The above is a matter of opinion provided for general information purposes only and is not intended as investment advice. Information and analysis above are derived from sources and utilising methods believed to be reliable, but we cannot accept responsibility for any losses you may incur as a result of this analysis. Individuals should consult with their personal financial advisors.
Guy Lerner Archive |
© 2005-2022 http://www.MarketOracle.co.uk - The Market Oracle is a FREE Daily Financial Markets Analysis & Forecasting online publication.